Fig. 1.
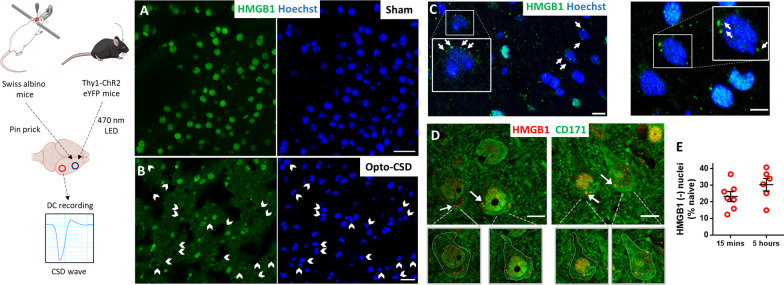
CSD causes the release of HMGB1-immunopositive puncta from neuronal nuclei. CSD was triggered by pinpricking the frontal cortex in wild-type mice under anesthesia or by depolarization of cortical neurons with a blue LED light through the intact skull in freely moving Thy1-ChR2 eYFP mice. The ignition of each CSD wave was confirmed by recording the negative DC current shift at a location posterior to the stimulation site (left). A Most nuclei (labeled blue with Hoechst) were immunopositive for HMGB1 (green) in the cortex of sham-operated mice (A), while CSD caused the loss of nuclear HMGB1 labeling (white arrowheads) in neurons within 15 min (B–D). B CSD triggered by noninvasive optogenetic stimulation induced HMGB1 release similarly to pinprick-triggered CSD in wild-type mice (C, D). Cells that lost nuclear HMGB1 immunopositivity are marked with arrowheads in the green channel in parallel with their corresponding nuclei labeled with Hoechst in blue channel. C HMGB1-positive puncta (green) scattered out of the nucleus (blue) were visible in neurons that lost most of their nuclear HMGB1 labeling (white arrows). D Many HMGB1-positive puncta (red, white arrows) were present within the cytoplasm around the nuclei of cortical neurons identified by CD171 immunolabeling (green). Boundaries of neuronal cytoplasm and nucleus are delineated in the insets below to better illustrate distribution of the puncta. Shedding of HMGB1-labeled puncta from cells that lost their nuclear HMGB1 immunopositivity (completely or partially) was noticeable as soon as 15 min after CSD. White arrows in C and D mark puncta in proximity to the nuclei, suggesting that HMGB1 is released in vesicles. E The ratio of HMGB1-immunonegative nuclei (% of naïve Hoechst-positive nuclei) did not increase from 15 min to 5 h after CSD (p = 0.23, Mann–Whitney U test), suggesting that HMGB1 is released at once right after CSD. Insets are magnified images of the boxed areas. Images are maximum projections of confocal z-stacks. Scale bars: 10 µm

