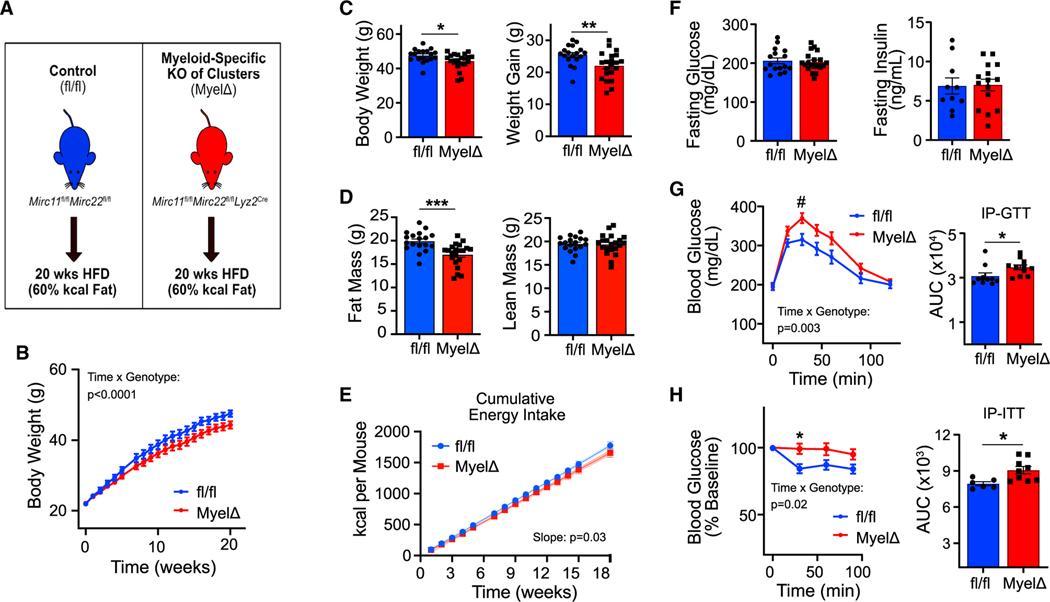
Figure 1. Myeloid-specific expression of the miR-23–27-24 clusters protects against obesity-induced glucose and insulin intolerance.
(A) Schematic of dietary interventions. Mirc11fl/flMirc22fl/fl (fl/fl) and Mirc11fl/flMirc22fl/flLyz2Cre (MyelΔ) mice were fed a high-fat diet (HFD) for 20 weeks.
(B–E) Body weight curves (B) (two-way ANOVA with Šídák’s multiple comparison test), final body weights and weight gain (C) (two-tailed t test), final body composition measurements by NMR (D) (two-tailed t test), or cumulative energy intake (E) (simple linear regression).
(F) Fasting glucose and insulin levels were recorded following HFD feeding (two-tailed t test).
(G–H) Intraperitoneal glucose (1 g/kg lean mass) (G) or insulin tolerance tests (0.5 U/kg lean mass) (H) were performed on fl/fl and MyelΔ mice after dietary intervention (two-way ANOVA with Šídák’s multiple comparison test for curves; two-tailed t test for area under curve [AUC] comparisons). Male mice 8–10 weeks old at beginning of dietary intervention. Each dot in bar graphs represents one mouse after HFD feeding. B&E, 18–21 mice per genotype. ±SEM. #p = 0.07, *p ≤ 0.05, **p < 0.01, ***p < 0.001. See also Figure S1.

