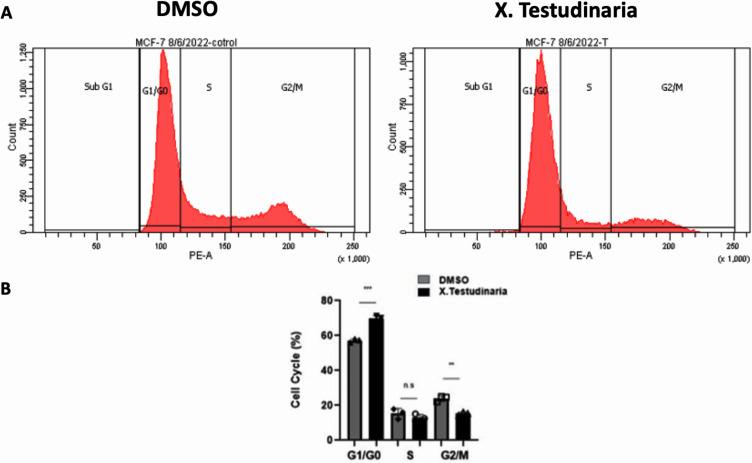
Figure 3.
The effect of X. testudinaria on the cell cycle of MCF-7 cells. (A) shows the cell cycle distribution profiles of MCF-7 cells treated with X. testudinaria for 48 hours, determined by flow cytometry using PI. (B) demonstrates the proportion of cells in each phase of the cell cycle that are present in each group, with data from three replicates shown as mean ± SD (n=3). ns, P > 0.05. **, P ≤ 0.01. ***, P ≤ 0.001 vs control group.

