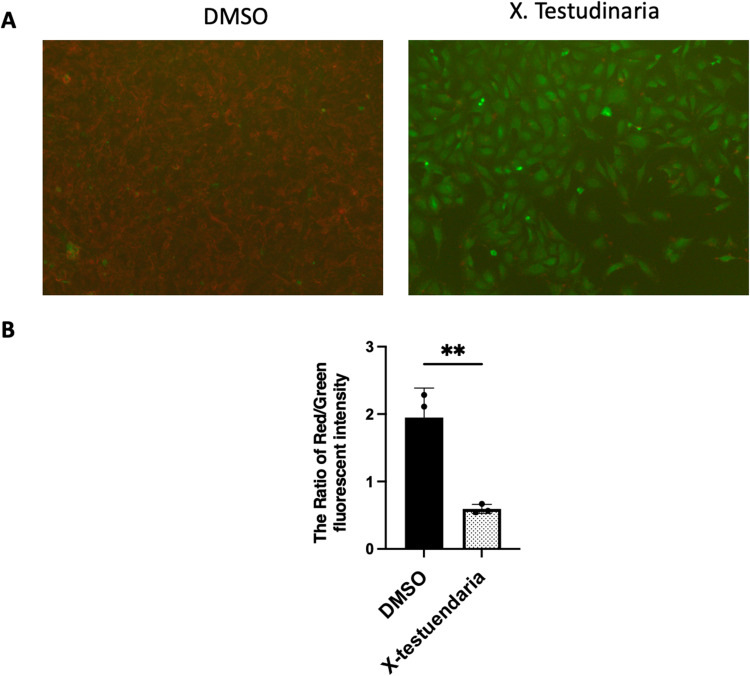
Figure 5.
Effect of X. testudinaria on mitochondrial membrane potential. (A) displays decline of the membrane potential of the mitochondria after exposure to DMSO, X. testudinaria for 48 hours at a magnification of 40x. (B) shows a quantitative analysis of the ratio of the red fluorescent intensity to the green fluorescent intensity, with the results expressed as the mean ± SD of triplicates. **, P ≤ 0.01 vs control group.

