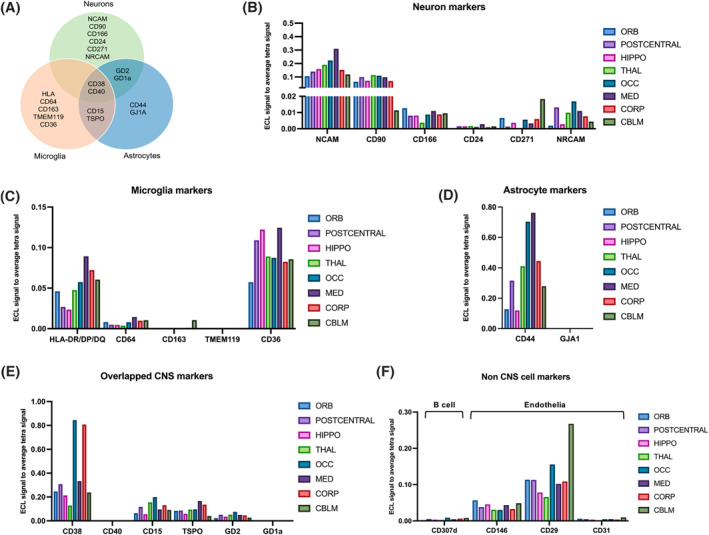
FIGURE 4.

Cell‐of‐origin marker profile on the bdEV surface. (A) Distribution of markers by cell types: neurons, microglia, and astrocytes. Cell‐enriched markers were used as bdEV capture antibodies; EVs were then detected by a signal from a cocktail of anti‐tetraspanin antibodies (CD63, CD81, and CD9). Levels of neuron (B), microglia (C), astrocyte (D), overlapping (E) and non‐CNS cell (F) markers were then normalized to the average of tetraspanin capture spot signals.
