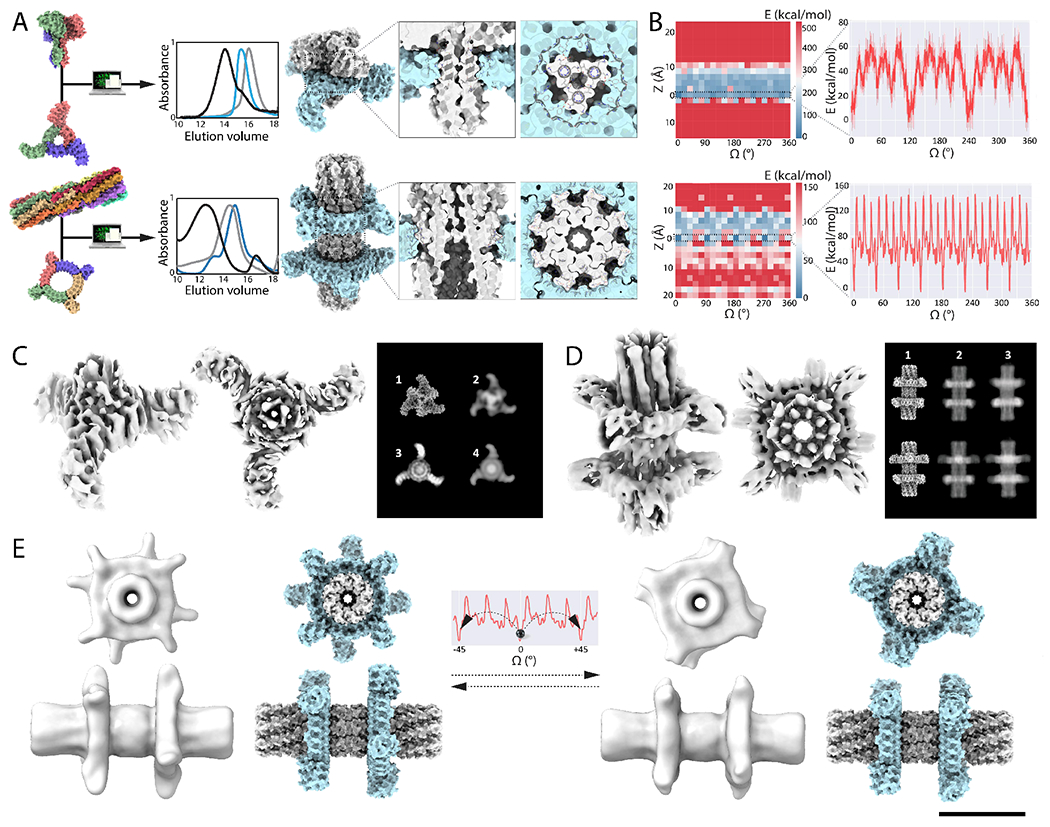
Fig. 4: Computational sculpting of the energy landscape by design of interface side-chain interactions.

(A) From Left to right: Models of C3 axle (C3_A1), C3 rotor (C3_R1), D8 axle (D8_1) and C4 rotor (C4_1) used to design C3-C3 and D8-C4 axle-rotor assemblies. Overlaid SEC chromatograms (absorbance at 215 nm) of axle (grey), rotor (blue), and full assembly (black). Models of symmetry matched C3-C3_1 and quasisymmetric D8-C4 assemblies and close-ups on the interface reveal the shape complementary cogwheel topology. (B) Energy landscapes corresponding to the C3-C3 (Top) and to the D8-C4 axle-rotor assembly (Bottom); (Left) 2D Rotation-Translation energy landscapes showing a narrow band of low energy where the rotor sits on the axle. (Right) 1D rotational energy landscape has three main minima corresponding to the C3 symmetry of the interface with 9 additional lesser energy minima for C3-C3, and eight main energy minima corresponding to the C8 symmetry of the interface and additional 18 lesser minimas for D8-C4. The energy landscapes were computed by scoring 10 independent Rosetta backbone and side-chains relax and minimization trajectories (solid red line with error bars depicting the standard deviation, kcal/mol as calculated by Rosetta) (C) Single particle cryoEM analysis of the C3-C3 assembly. The rotor is evident in the 6.5Å resolution electron density in the side and top views; only a portion of the axle is resolved. In the panel to the right, the experimental 2D class averages (3) match the projection of the design model more closely with conformational variability (4) than without (2); the design model is shown in (1). (D) Single particle cryoEM analysis of the designed D8-C4 rotor. The electron density (in grey) at 5.9Å resolution shows the main features of the designed structure and two distinct rotational states (1), also visible in the the simulated projections (2), which closely resemble the experimental 2D class average (3). (E) 3D variability analysis and computed rotational landscape of the D8-C4 axle-rotor assembly. The two resolved structures (shown in gray on left and right) are separated by a 45° rotational step. Corresponding computational models are shown in spacefill (blue and gray). Top row: top view, bottom row, side view. Scale bar: 10nm
