
Figure 1. SNORD46 correlates with BMI and immune resistance.
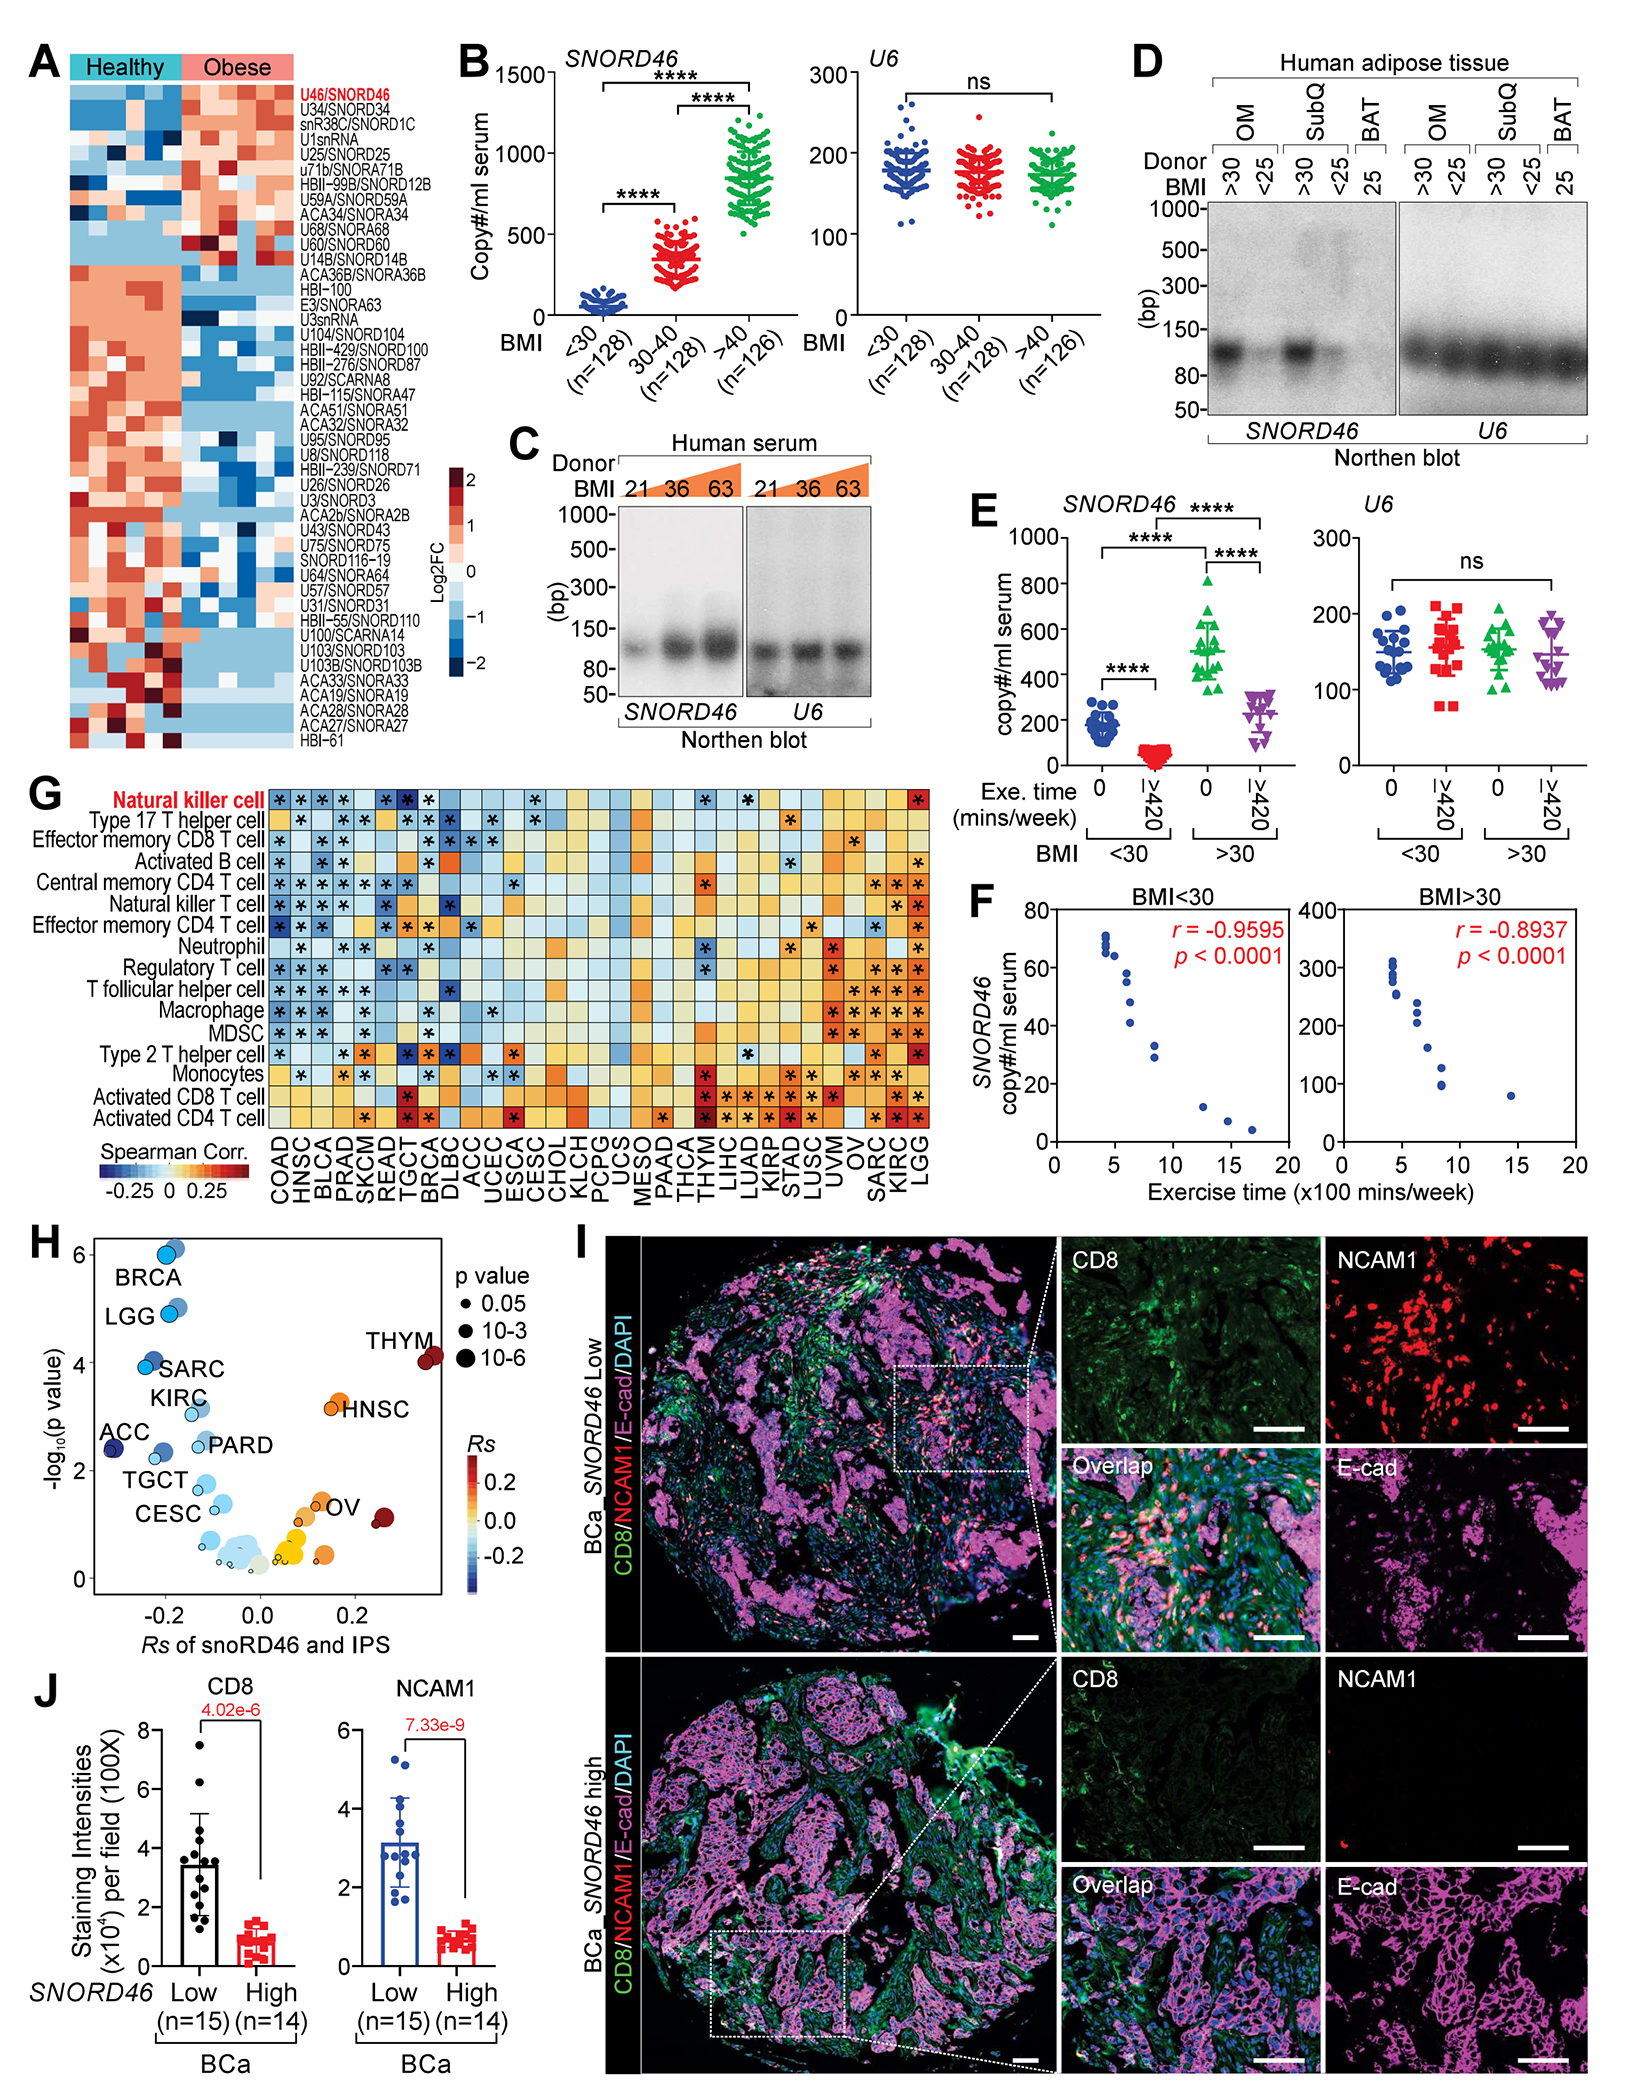
(A) Heatmap of snoRNA expression of indicated human serum samples.
(B) Copy number of SNORD46 (left) or U6 (right) in serum of human donors with BMI < 25, 30-40, or > 40 (n = 128, 128, 126 donors).
(C and D) Northern blotting using indicated probes of indicated human serum (C), or human adipose tissues as indicated (D).
(E) Copy number of SNORD46 (left) or U6 (right) in serum with indicated BMI, without or with exercise (0, ≥ 420 min/week), n = 18 donor per group, one-way ANOVA.
(F) Pearson correlation between SNORD46 copy number and exercise time of donors with BMI < 30 (left) or BMI > 30 (right), n = 18 (BMI < 30), 18 (BMI > 30) donor, Fisher’s exact test.
(G and H) The spearman’s correlation of SNORD46 expression and immune cell type enrichment (G) and immunophenoscore (IPS) (H) in 28 cancer types.
(I and J) Representative multi-IHC images (I) and statistical analysis of CD8 and NCAM1 (J) of breast cancer tissues from serum SNORD46-high or SNORD46-low breast cancer patients. Scale bars, 100 μm. Error bars, SD, n = 15, 14 tissues, unpaired Student’s t-test.