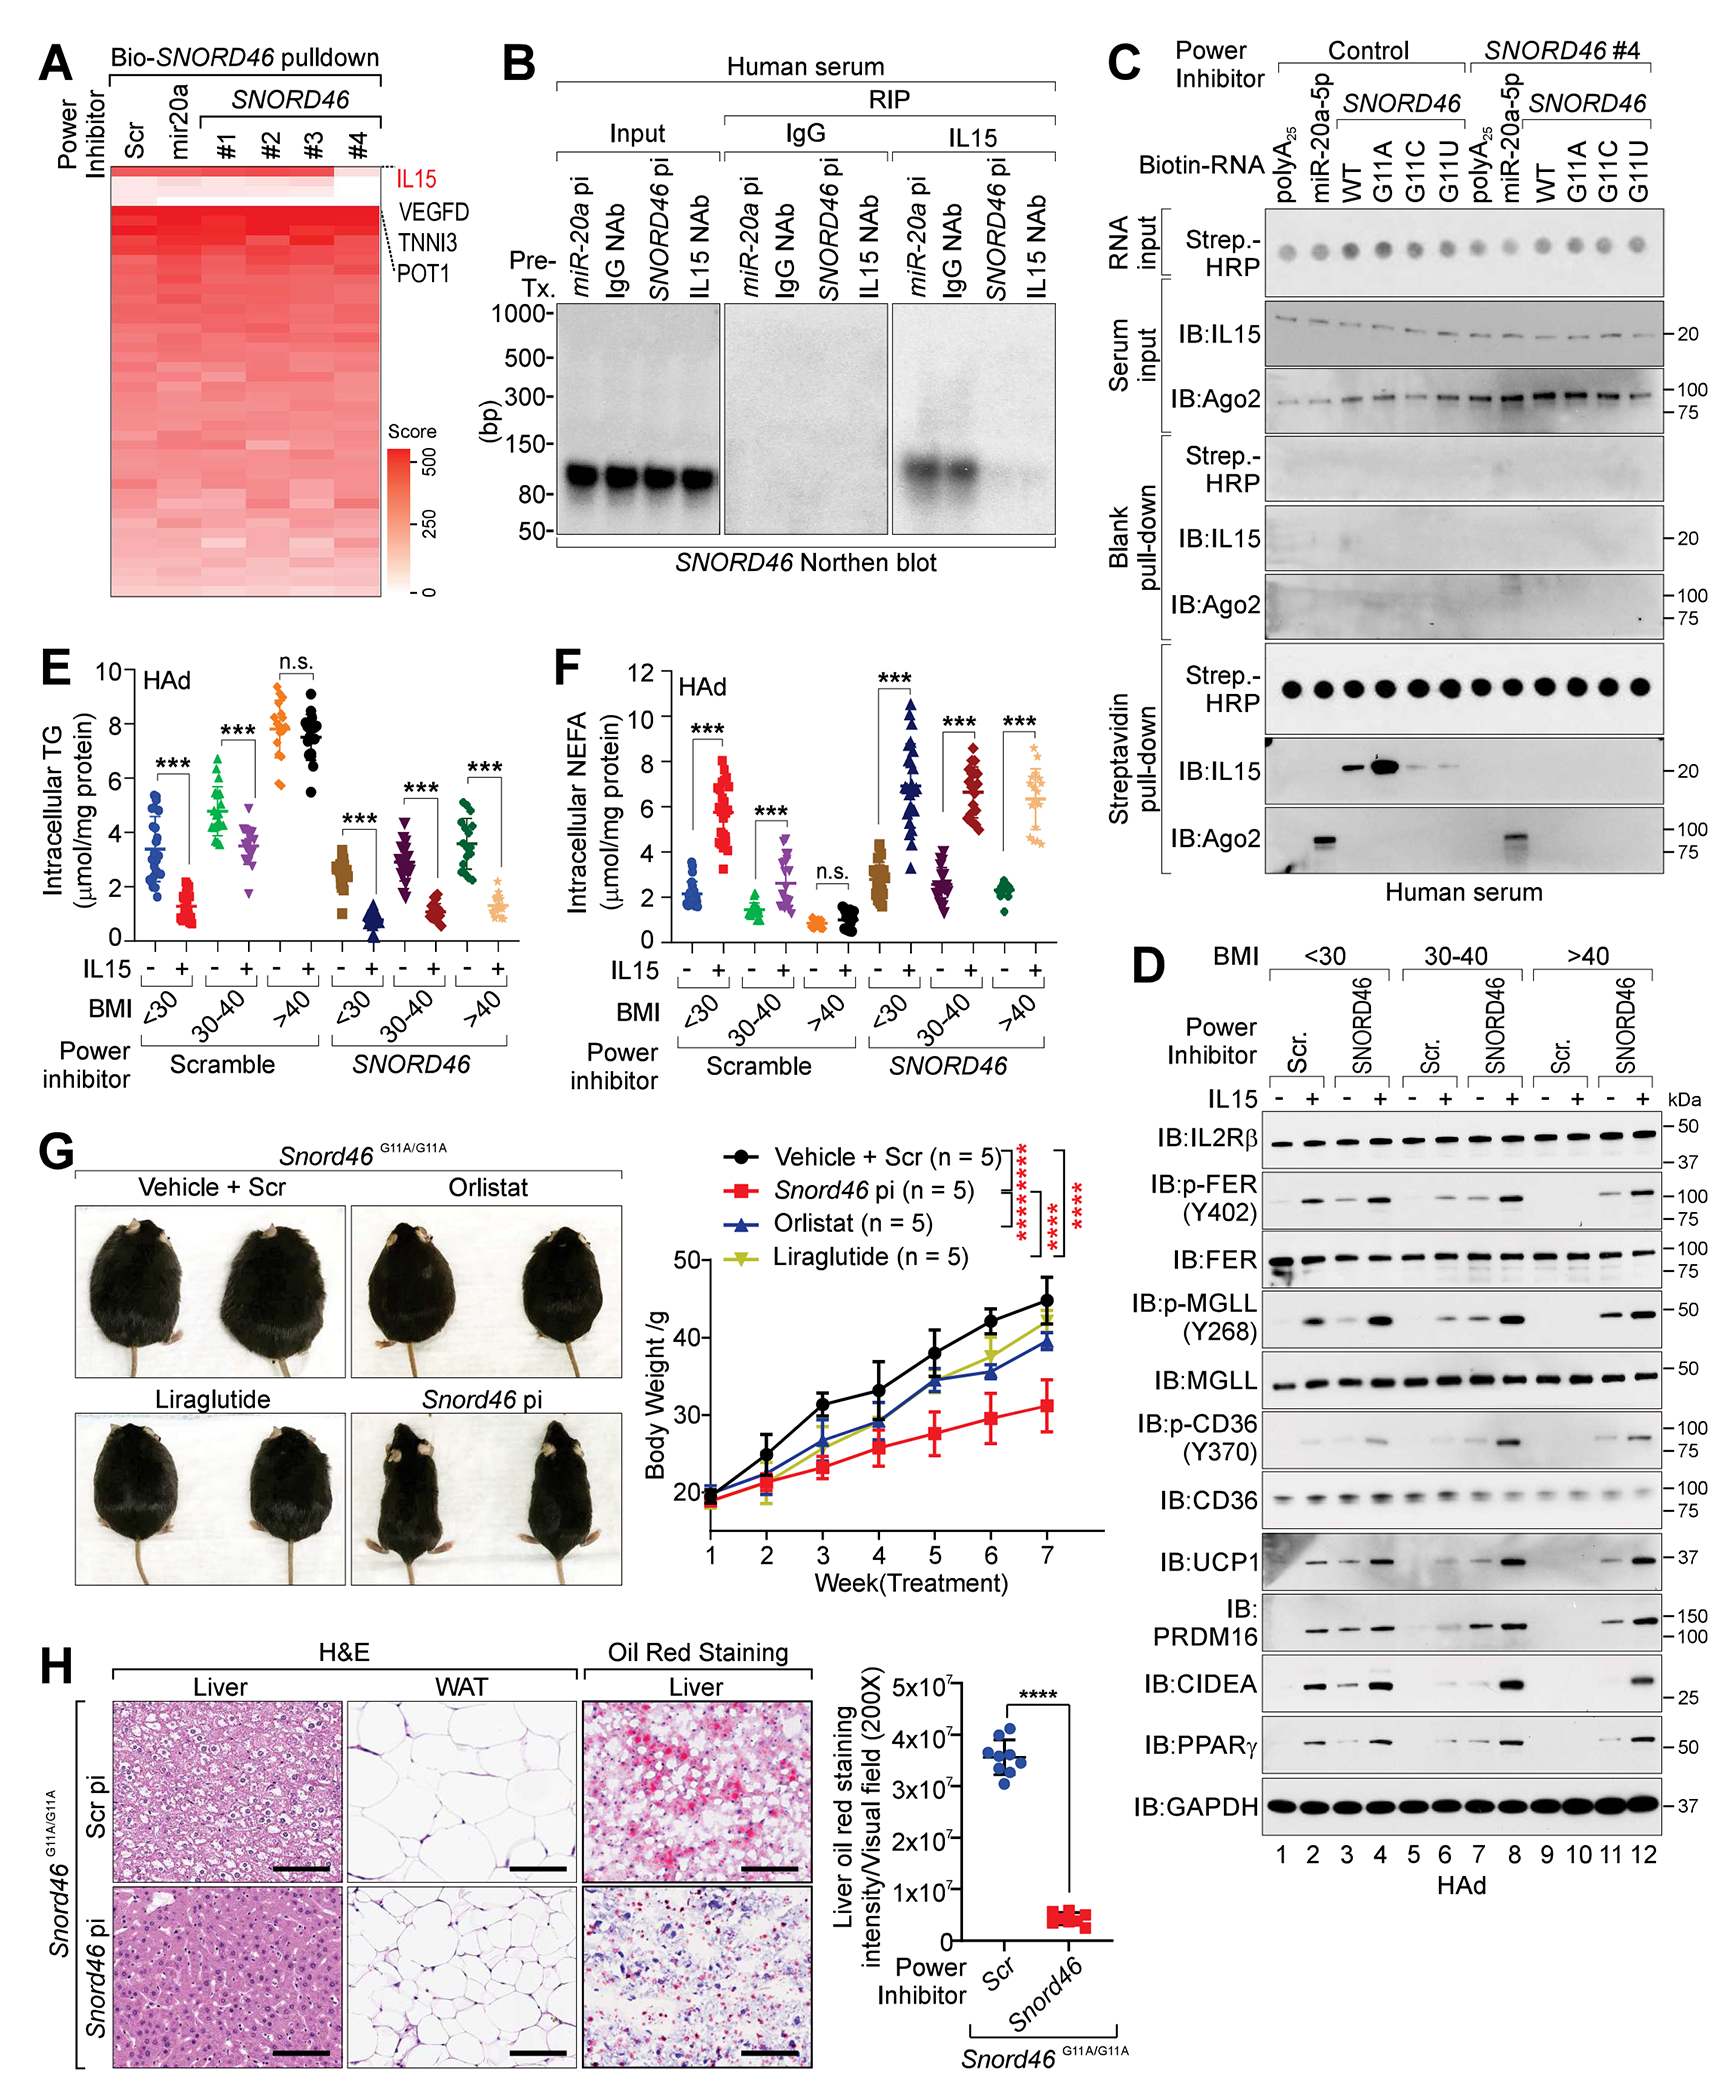
Figure 6. SNORD46 power inhibitors antagonize obesity.

(A) Heatmap of the protein identification score for biotinylated Scramble, SNORD46 or miR-20a pull-down in the presence of indicated power inhibitors. R: biological replicate.
(B) Northernblot of SNORD46 in human serum treated with indicated power inhibitors or antibodies.
(C) IB detection of proteins associated with biotinylated RNA (wild-type and indicated mutants) in human serum treated with indicated power inhibitors.
(D) IB detection of indicated proteins in differentiated human adipocytes collected from donors with BMI < 25, 30-40, or > 40 and treated with IL15 and/or indicated power inhibitors.
(E and F) Measurement of intracellular TG (E) or intracellular NEFA (F) levels in differentiated human adipocytes collected from donors with BMI < 25 (n = 24), 30-40 (n= 19), or > 40 (n = 17) and treated with indicated power inhibitors with or without IL15 stimulation. Error bars, SD, two-way ANOVA.
(G) Left, representative images; right, body weight measurement of Snord46G11A/G11A mice treated with scramble (Scr), Snord46 power inhibitor (pi), Orlistat or Liraglutide as indicated. Error bars, SD, n = 5 mice per group, one-way ANOVA.
(H) Representative H&E and Oil Red O staining of liver or WAT (left) and statistical analysis of staining intensities of liver sections (right) from Snord46G11A/G11A mice treated with scramble or Snord46 power inhibitor. Scale bars, 100 μm. Error bars, SD, n= 9, 8 mice, Student’s t-test.
