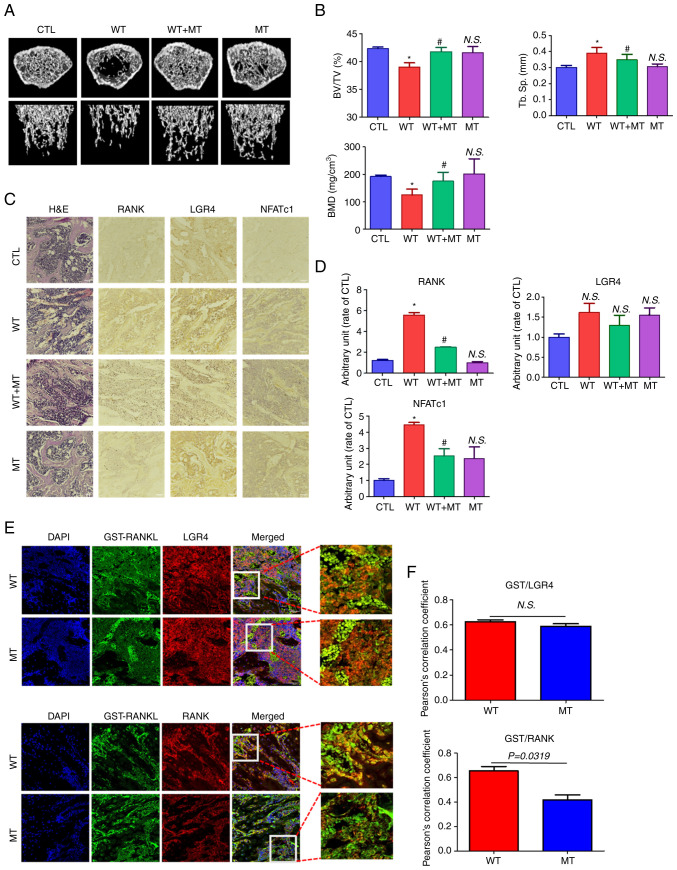
Figure 6.
Effect of MT RANKL on RANKL-induced bone loss in a mouse model. (A) Representative micro-computed tomography images of the distal femurs of mice. (B) Measurements of BV/TV, Tb. Sp and BMD. Data are presented as the mean ± SD. *P<0.01 vs. control group; #P<0.01 vs. WT RANKL. (C) Immunohistochemistry staining of RANK, LGR4 and NFATc1 in femurs. Magnification, ×200; scale bar, 10 μm. (D) Densitometric analysis of immunohistochemistry. (E) Confocal microscopic images of the co-localization of GST-RANKL with LGR4 and RANK in WT RANKL- and MT RANKL-treated mice. Magnification, ×200; scale bar, 10 μm. (F) Pearson's correlation coefficient was calculated from the merged images of GST/LGR4 and GST/RANK. Data are presented as the mean ± SD of three independent measurements. BMD, bone mineral density; BV/TV, bone volume/tissue volume; CTL, control; GST, glutathione S-transferase; H&E, hematoxylin and eosin; LGR4, leucine-rich repeat-containing G-protein-coupled receptor 4; MT, mutant; NFATc1, nuclear factor of activated T cells, cytoplasmic, calcineurin-dependent 1; N.S., not significant; RANK, receptor-activated nuclear factor-κB; RANKL, RANK ligand; SD, standard deviation; Tb. Sp, trabecular spacing.

