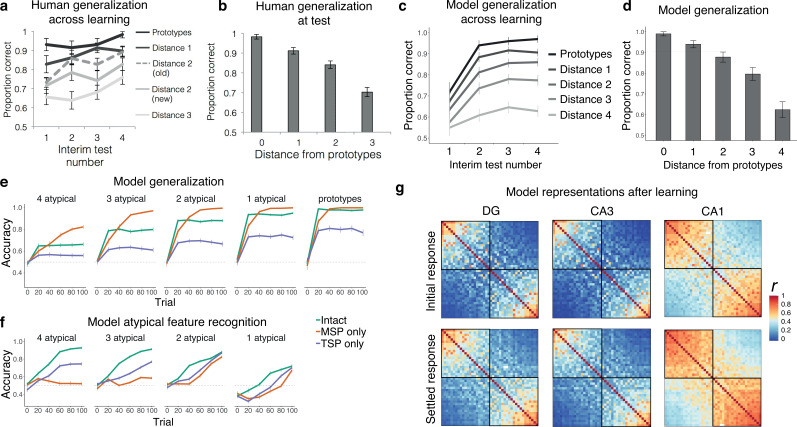
Figure 5. Simulation 3: intermixed categories with varying typicality.
Human generalization across (a) learning and (b) test, for varying levels of typicality, from Figure 3 in Bowman et al., 2020. Intact model generalization across (c) learning, with 10 trials prior to each interim test, and (d) at the end of learning. Source data can be found in Figure 5—source data 1. (e) Model generalization broken down by typicality and model type. (f) Model atypical feature recognition broken down by typicality and model type. Source data can be found in Figure 5—source data 2. (g) Representational similarity for the initial and settled response of the intact network. Each item appears in the rows and columns of the heatmap, organized by most prototypical members of one category to most prototypical members of the other. Source data can be found in Figure 5—source data 3.

