. 2023 Dec 11;12:RP91263. doi: 10.7554/eLife.91263

Figure 6. Deletion of Shh in mossy cells increases age-related NSC decline.

(A) Representative immunofluorescence images of Sox2+ (green) GFAP+ (red) radial NSCs in 9- to 11-month-old control and Shh-cKO mice. High magnification of inset images are shown in the right panels. (B) Quantification of Sox2+ GFAP+ radial NSCs. Values represent mean ± standard error of the mean (SEM); *p < 0.05. Unpaired t-test (two-tailed, control: n = 4, Shh-cKO: n = 3 mice). (C) Experimental scheme of long-term tracing of proliferating NSCs in aged mice. Nine- to eleven-month-old control and Shh-cKO mice were administrated with 5-bromo-2′-deoxyuridine (BrdU) via drinking water for 5 days and were analyzed on the last day of BrdU administration (day 0), and at 10 days and 4 weeks after BrdU administration. Schematic of NSC fate after proliferation. (D) Representative immunofluorescence images of proliferating Sox2+ (green) NSCs labeled with BrdU (cyan) at day 0 and radial Sox2+ (green) GFAP+ (red) NSCs retaining BrdU (cyan) at 10 days and 4 weeks after BrdU administration. (E) Quantification of the fraction of NSCs retaining BrdU until 10 days and 4 weeks after BrdU administration in aged control and Shh-cKO mice. Values represent mean ± SEM; *p < 0.05, **p < 0.01. Unpaired t-test (two-tailed, 10 days: control: n = 3, Shh-cKO: n = 4, 4 weeks: control: n = 5, Shh-cKO: n = 5 mice mice).

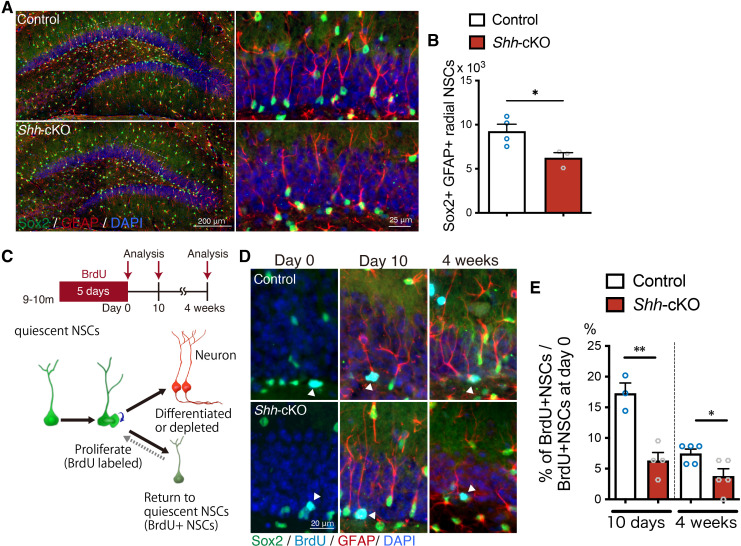
Figure 6—source data 1. Raw data for counts.

Figure 6.

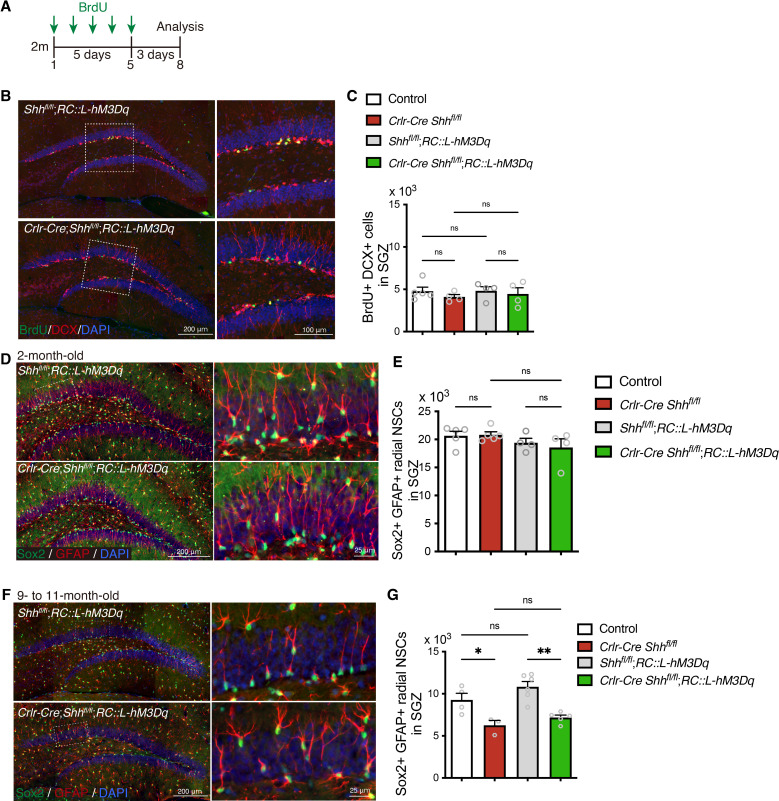
Figure 6—figure supplement 1. Expressing Designer Receptors Exclusively Activated by Designer Drugs (DREADD) activator does not affect neurogenesis and number of NSCs of Crlr-Cre Shh mice.

Figure 6—figure supplement 1.

(A) Experimental scheme of analyzing neurogenesis by 5-bromo-2′-deoxyuridine (BrdU) pulse labeling. The mice were injected with BrdU for 5 days and analyzed 3 days after last BrdU injection. (B) Representative immunofluorescence images for newborn neurons labeled with BrdU (green), DCX (red), and 4′,6-diamidino-2-phenylindole, dihydrochloride (DAPI; blue) in the SGZ of control (Cre-negative mice), Crlr-Cre;Shhfl/fl, Shhfl/fl;RosaDIO-hM3Dq, and Crlr-Cre;Shhfl/fl;RosaDIO-hM3Dq mice without CLZ administration. (C) Quantification of newborn neurons in the SGZ. Values represent mean ± standard error of the mean (SEM); ns: p > 0.05. One-way analysis of variance (ANOVA) with Tukey’s multiple comparison test (control: n = 5, Crlr-Cre;Shhfl/fl: n = 4, Shhfl/fl;RosaDIO-hM3Dq: n = 4, Crlr-Cre;Shhfl/fl;RosaDIO-hM3Dq: n = 4 mice). (D) Representative immunofluorescence images of radial NSCs labeled with Sox2 (green), GFAP (red), and DAPI (blue) in the SGZ of 2-month-old mice. (E) Quantification of Sox2+ GFAP+ radial NSCs in the SGZ. Values represent mean ± SEM; ns: p > 0.05. One-way ANOVA with Tukey’s multiple comparison test (control: n = 5, Crlr-Cre;Shhfl/fl: n = 5, Shhfl/fl;RosaDIO-hM3Dq: n = 4, Crlr-Cre;Shhfl/fl;RosaDIO-hM3Dq: n = 4 mice). (F) Representative immunofluorescence images of radial NSCs labeled with Sox2 (green), GFAP (red), and DAPI (blue) in the SGZ of 9- to 11-month-old mice. (G) Quantification of number of GFAP+ Sox2+ radial NSCs in the SGZ. Values represent mean ± SEM; ns: p > 0.05, *p < 0.05, **p < 0.01. One-way ANOVA with Tukey’s multiple comparison test (control: n = 4 , Crlr-Cre;Shhfl/fl: n = 3, Shhfl/fl;RosaDIO-hM3Dq: n = 6, Crlr-Cre;Shhfl/fl;RosaDIO-hM3Dq: n = 5 mice).
Figure 6—figure supplement 1—source data 1. Raw data for counts.