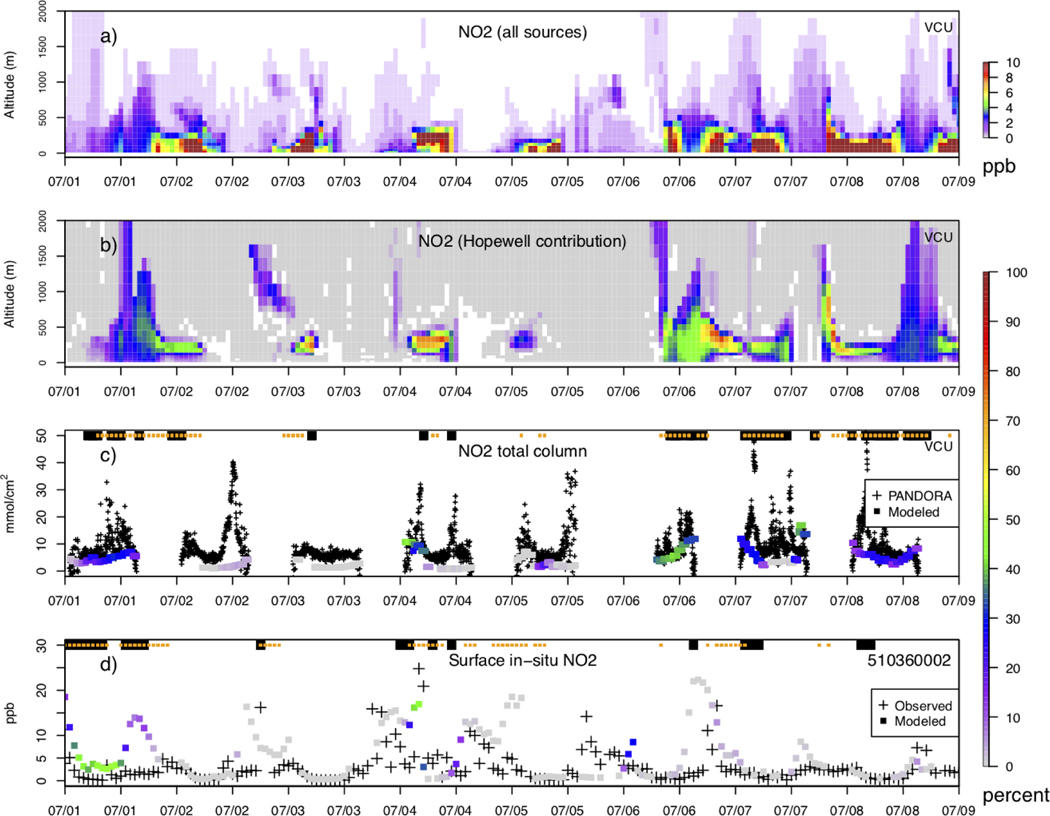
Figure 4.
CMAQ model (2 km resolution) predicted NO2 by vertical layer at the VCU PANDORA monitor location for July 2017 (local time): NO2 from all sources (panel a) and the fraction of total NO2 from Hopewell (panel b). Ground-based NO2 tropospheric column measurements made with a PANDORA located downwind of Hopewell were paired with CMAQ model NO2 tropospheric column predictions colored by the percent contribution of Hopewell (panel c). Observed and CMAQ model predicted NO2 (colored by the percent contribution of Hopewell) at a routine surface monitor near Hopewell is also shown (panel d). The orange (modeled) and black (observed) traces at the top of panels c and d indicate when winds were from the direction of Hopewell.

