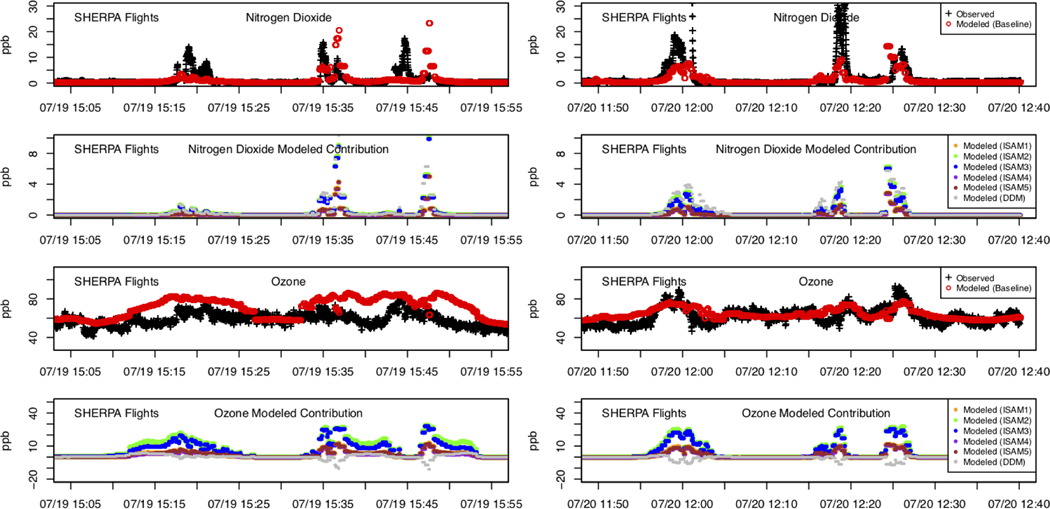
Figure 6.
Aircraft measurements of O3 and NO2 made in the Hopewell plume during the July 19 (left panels) and 20 (right panels), 2017 paired with CMAQ model predictions. Modeled contribution from Hopewell estimated using source attribution approaches is also shown. The distance of the aircraft from Hopewell is shown in Figure S3.

