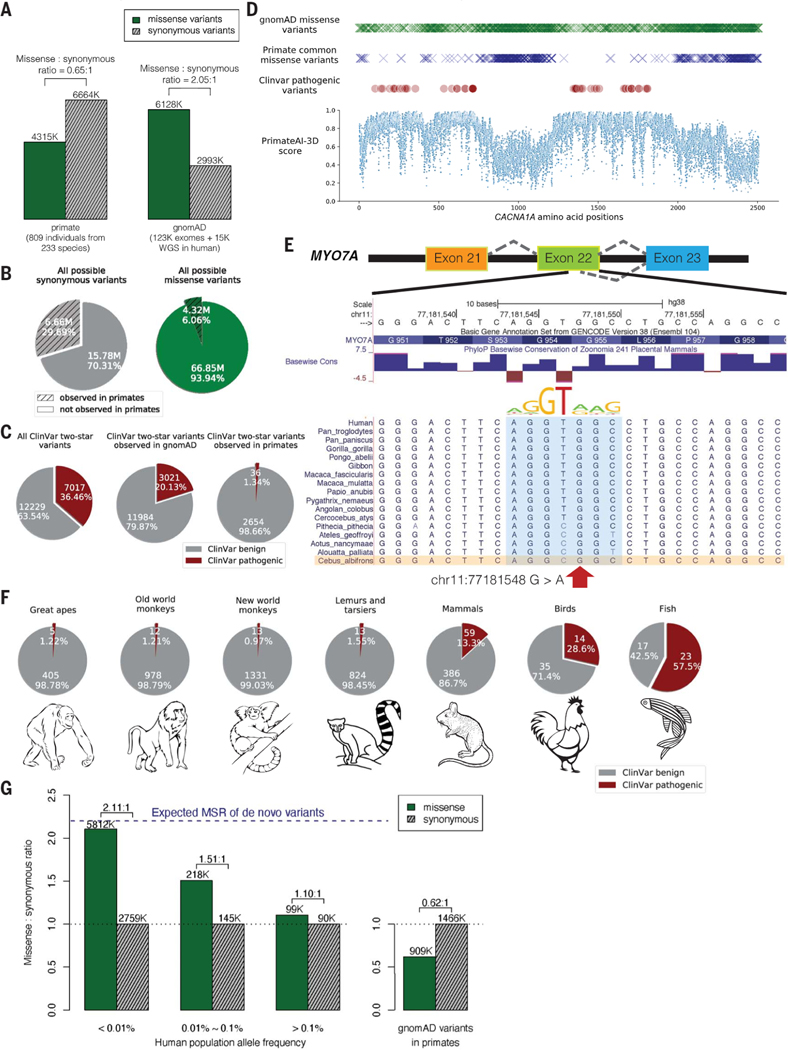
Fig. 1. Common primate variants are largely benign in humans.
(A) Counts of missense (solid green) and synonymous (shaded gray) variants from primates compared with the gnomAD database. Missense:synonymous counts and ratios are displayed above each bar. (B) Fractions of all possible human synonymous (gray) and missense variants (green) observed in primates. (C) Counts of benign (gray) and pathogenic (red) missense variants with two-star review status or above in the overall ClinVar database (left pie chart), compared with ClinVar variants observed in gnomAD (middle), and compared with ClinVar variants observed in primates (right). Conflicting benign and pathogenic annotations and variants interpreted only with uncertain significance were excluded. (D) Observed gnomAD (green) or primate (blue) missense variants in each amino acid position in the CACNA1A gene. Red circles represent the positions of annotated ClinVar pathogenic missense variants. Bottom scatterplot shows PrimateAI-3D predicted pathogenicity scores for all possible missense substitutions along the gene. (E) Multiple sequence alignment showing the ClinVar pathogenic variant chrll:77181548 G>A (red arrow) creating a cryptic splice site in human sequence (extended splice motif, blue). This variant is tolerated in Cebus Albifrons and other species with a G>C synonymous change in the adjacent nucleotide that stops the splice motif from forming. (F) Pie charts showing the fraction of benign (gray) and pathogenic (red) missense variants with ClinVar two-star review status or above in great apes, Old World monkeys, New World monkeys, lemurs/tarsiers, mammals, chicken, and zebrafish. (G) Missense:synonymous ratios (MSR) across the human allele frequency spectrum, with MSR of human variants seen in primates shown for comparison. The blue dashed line represents the expected missense:synonymous ratio of de novo variants. Colors and legend are the same as (A).

