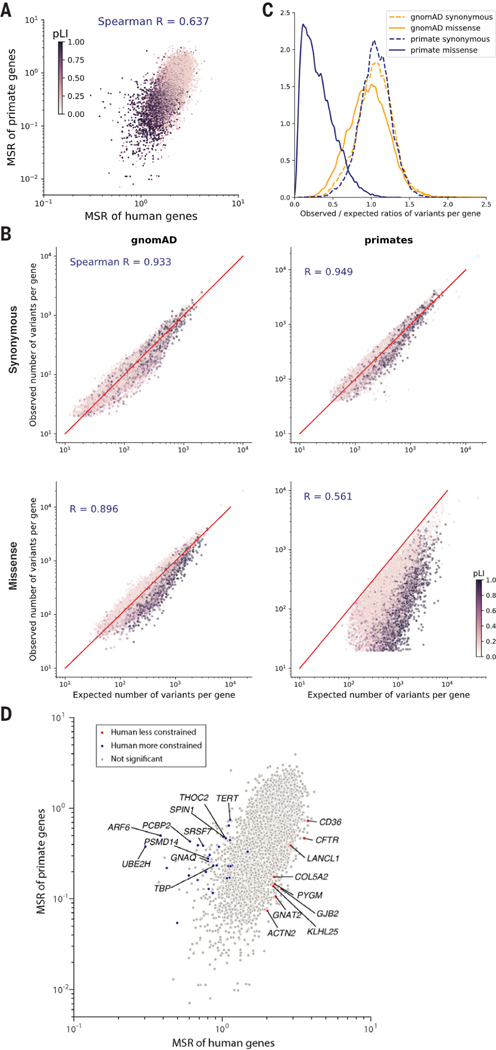
Fig. 2. Selective constraint of primate genes compared with humans.
(A) Scatter plot of missense: synonymous ratios between primate and human genes. Each gene is colored by its pLI score, with darker points showing haploinsufficient genes. (B) Observed and expected counts of synonymous (top) and missense (bottom) variants per gene in gnomAD (left) and primates (right). Genes are colored by their pLI scores. (C) Distributions of observed and expected ratios of synonymous (dashed lines) and missense (solid lines) variants for all genes. Results for primate genes (orange) and gnomAD genes (blue) are shown. (D) Scatter plot of missense:synonymous ratios between primate and human genes. Highlighted points are genes that are under significantly stronger (blue) or weaker (red) constraint in humans compared with nonhuman primates under both methods (Benjamini-Hochberg FDR < 0.05) and gray points show nonsignificant genes. The top 10 genes with the largest effect sizes in either direction are labeled.

