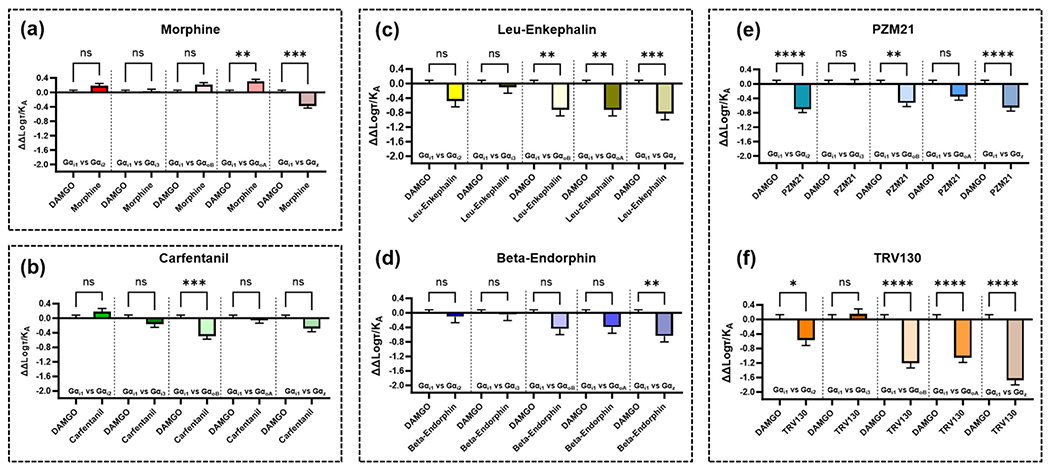
Fig. 10.

Graphs showing the ΔΔlog(τ/KA) values as calculated by fitting concentration-response curves obtained from Faouzi et al. [24] to the operational model and comparing first to DAMGO and then between Gαil and the other Gα isoforms measured. Bias calculations were carried out for (a) morphine, (b) carfentanil, (c) leu-enkephalin, (d) beta-endorphin, (e) PZM21 and (f) TRV130. Error bars show the pooled SEM for the ΔΔlog(τ/KA) values. Statistical significance was determined using a one-way ANOVA with šídák post-test to compare between each pair as indicated by pairwise comparisons, (ns = no significance, * p < 0.05; ** p < 0.006; *** p < 0.0002; **** p < 0.0001.
