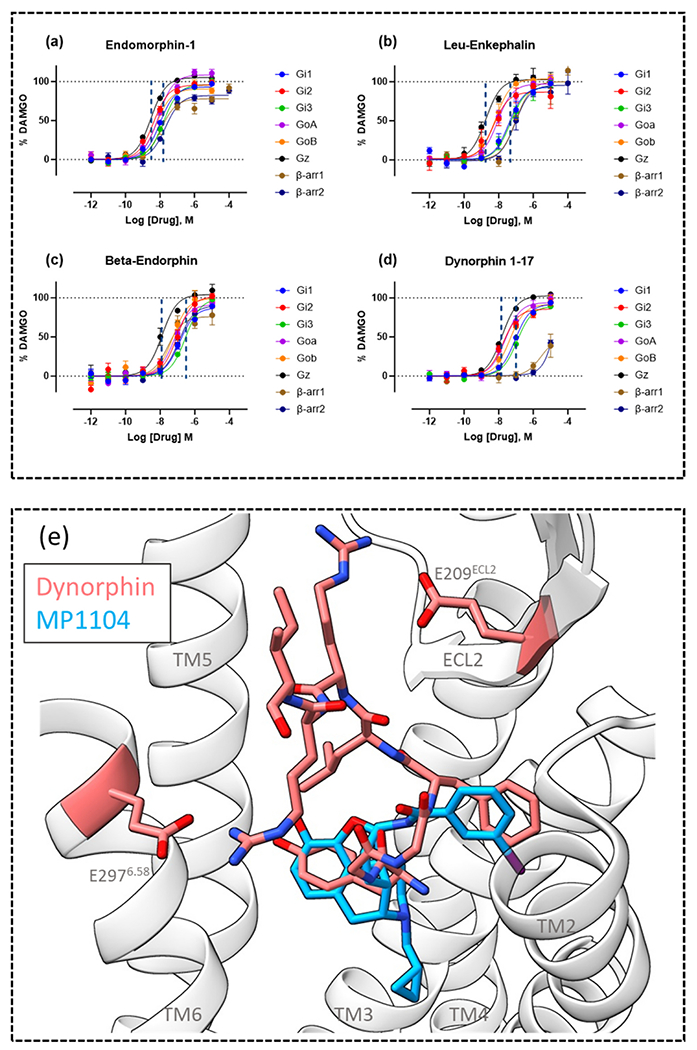
Fig. 3.

Concentration-response curves of endogenous peptides (a) endomorphin-1, (b) leu-enkephalin, (c) beta-endorphin and (d) dynorphin 1–17. Concentration-response curves were generated from MOR TRUPATH BRET and a MOR β-arrestin1/2 recruitment BRET assay. (e) Image of the superimposed poses of the cryo-EM structures of KOR bound to endogenous peptide dynorphin and small molecule MP1104, ribbons from the dynorphin bound KOR structure are shown, with residues E209ECL2 and E2976.58 highlighted and labelled. TMs are labelled, TM7 has been removed for clarity. Images were made in ChimeraX from the cryo-EM structures obtained from the protein databank for dynorphin (PDB: 8F7W) and MP1104 (PDB: 6B73).
Material from: Faouzi et al. [24].
