Abstract
Background:
Analyses of author collaborations and keyword co-occurrences are frequently used in bibliographic research. However, no studies have introduced a straightforward yet effective approach, such as utilizing ChatGPT with Code Interpreter (ChatGPT_CI) or the R language, for creating cluster-oriented networks. This research aims to compare cluster analysis methods in ChatGPT_CI and R, visualize country-specific author collaborations, and then demonstrate the most effective approach.
Methods:
The research focused on articles and review pieces from Medicine (Baltimore) published in 2023. By August 20, 2023, we had gathered metadata for 1976 articles using the Web of Science core collections. The efficiency and effectiveness of cluster displays between ChatGPT_CI and R were compared by evaluating their time consumption. The best method was then employed to present a series of visualizations of country-specific author collaborations, rooted in social network and cluster analyses. Visualization techniques incorporating network charts, chord diagrams, circle bar plots, circle packing plots, heat dendrograms, dendrograms, and word clouds were demonstrated. We further highlighted the research profiles of 2 prolific authors using timeline visuals.
Results:
The research findings include that (1) the most active contributors were China, Nanjing Medical University (China), the Medical School Department, and Dr Chou from Taiwan when considering countries, institutions, departments, and individual authors, respectively; (2) the highest cited articles originated from Medicine (Baltimore) accounting for 4.53%: New England Journal of Medicine, PLOS ONE, LANCET, and The Journal of the American Medical Association, with respective contributions of 3.25%, 2.7%, 2.52%, and 1.54%; (3) visual cluster analysis in R proved to be more efficient and effective than ChatGPT_CI, reducing the time taken from 1 hour to just 3 minutes; (4) 7 cluster-focused networks were crafted using R on a custom platform; and (5) the research trajectories of 2 prominent authors (Dr Brin from the United States and Dr Chow from Taiwan) and articles themes in Medicine 2023 were depicted using timeline visuals.
Conclusions:
This research highlighted the efficient and effective methods for conducting cluster analyses of author collaborations using R. For future related studies, such as keyword co-occurrence analysis, R is recommended as a viable alternative for bibliographic research.
Keywords: author collaborations, chatGPT with Code Interpreter, cluster analysis, country-specific author collaborations, R language
Key points.
-
•
The study compared cluster analysis methods in ChatGPT with code interpreter and R, emphasizing efficient visualization of country-specific author collaborations using articles from Medicine (Baltimore) 2023.
-
•
The findings revealed R’s superiority in efficiency over ChatGPT_CI, decreasing time consumption from an hour to 3 minutes for visual cluster analysis.
-
•
The research promotes R as a recommended tool for future bibliographic studies, especially for keyword co-occurrence analysis.
1. Introduction
Social network analysis (SNA)[1,2] is a discipline that examines the interconnectedness among individuals, groups, and organizations.[3] By leveraging mathematical and computational methodologies, it explores the intricacies, attributes, and patterns present within social networks.[4] While its applications span from understanding communication pathways and organizational behaviors[5] to informing health strategies, the latter remains comparatively less studied.[3] Tools such as Gephi,[6] Python,[7] R,[8] and Excel[9] are instrumental in facilitating SNA.
The landscape of SNA is enriched by a myriad of open-source tools that are readily available to users.[10,11] Scholars frequently utilize bibliometric software such as CiteSpace,[12] VOSviewer,[13] and Bibexcel[9] for coword analyses, focusing on both author partnerships and keyword dynamics.[13,14] Nonetheless, the categorization methodologies (e.g., cluster analysis[15,16]) in these tools often remain nebulous, lacking clarity and consistency.[17] Such ambiguities can lead to divergent outcomes in unsupervised learning. Various methods, such as nearest distance or correlation coefficient, may produce different results, especially in the case of intricate co-occurrence relationships between the authors,[18] posing challenges to researchers.
1.1. Problems in traditional coword analysis
In a study entitled topological structure analysis of the protein–protein interaction network in budding yeast,[19] the authors employed a spectral technique rooted in graph theory to reveal concealed topological structures within protein–protein interaction networks. Their findings highlighted these hidden structures as biologically pertinent functional groups, introducing a novel approach for deducing the roles of previously uncharacterized proteins.
Applying this technique to a yeast protein network, they discerned 48 quasicliques and 6 quasibipartites, subsequently attributing functions to 76 previously undefined proteins. However, this study[19] faced challenges synonymous with others that harness SNA or coword analysis (i.e., remain nebulous, lacking clarity and consistency[20]). These hurdles encompass the intricacies of deciphering expansive networks abundant in connections, clusters overloaded and overwhelmed with vertices due to spectral analysis techniques, and ambiguous methodologies that pose challenges for replicating the research in subsequent studies (i.e., absence of a simple and effective cluster method introduced and demonstrated for readers).
1.2. Coword analysis in bibliometrics
In the field of bibliometrics, professionals frequently utilize tools like CiteSpace,[12] VOSviewer,[13] Bibexcel,[9] and other dedicated bibliometric software[11] to conduct co-word analyses, focusing on keywords[21,22] similarly to author collaborations (AC). However, deriving valuable insights from these analyses can be challenging, particularly when the software’s clustering methods are not clearly defined. While the Follower-Leading Clustering Algorithm (FLCA)[4,17,21,22] offers a streamlined yet effective method to (1) understand the interplay between individuals, groups, and organizations, (2) shed light on coword analysis clustering processes, and (3) deepen the understanding of ACs and keyword patterns,[4] the lack of a clear, hands-on demonstration still presents challenges for those wishing to replicate the research. This study aims to address and bridge this existing knowledge gap.
1.3. Visualization drawn with ChatGPT and in R
The recent introduction of ChatGPT’s “Code Interpreter” (ChatGPT_CI)[23,24] has enabled real-time code execution within conversations. This feature, which can generate complex visualizations such as clustered networks from uploaded files, has attracted our interest for performing coword analysis in bibliometrics using ChatGPT_CI.
Bibliometric research has surged in popularity recently,[25–27] with the R language[9] emerging as a preferred tool for visual bibliometric representations, especially in cluster naming.[28–32] Nonetheless, crafting network diagrams and related visuals in R[8] remains a hurdle, even with the advent of Bibliometrix, a comprehensive R-based tool for science mapping analysis.[33] To address these complexities, the fusion of the R platform[34] and the FLCA algorithm[4,17,21,22] presents a compelling approach to dissect coauthorship and coword analyses, posing a competitive alternative to ChatGPT_CI. Thus, a comparison of cluster analysis methods in ChatGPT_CI and R is necessary to determine which is more efficient and effective.
1.4. Study aims
This study seeks to contrast cluster analysis techniques in ChatGPT_CI and R, illustrating author collaborations specific to countries and subsequently showing the optimal strategy for readers.
2. Methods
2.1. Data source
We conducted a search on the Web of Science core collection database to collect article metadata in the Journal of Medicine (Baltimore) 2023. By August 20, 2023, our search yielded 1976 articles.
Since all data shown in Data S1, Supplemental Digital Content, http://links.lww.com/MD/K856 were obtained from Web of Science, ethical approval was not required for this study.
2.2. Goal 1: cluster analysis in ChatGPT_CI and R
2.2.1. Cluster analysis by ChatGPT.
Instructions provided with prompts to ChatGPT_CI after uploading a file[35] with country-specific author collaborations from Medicine (Baltimore) 2023 are as follows:
Using the uploaded data, with the first 3 columns detailing relations and the last 3 columns indicating vertex datasets, generate a social network colored by the “Cluster” column.
Enhance the node size according to the values in the fifth column of the network visualization.
The node representing China dominates and clutters the graph. Please refine it for a clearer and uncluttered display.
Adjust the font in the visualization to be larger and bold for each label, enhancing clarity and aesthetics.
Using the uploaded data’s last 3 columns, which represent the relation dataset, can you color-code clusters within the network visualization?
For steps 1 to 4, using the 6-column dataset that encompasses both relation and vertex attributes, ChatGPT_CI can produce a clustered network. Notably, clusters have previously been assigned to each country. Conversely, in Step 5, even without explicit cluster information provided to ChatGPT_CI, a similar clustered network emerges, paralleling the outcomes from Steps 1 to 4. This suggests that ChatGPT_CI, given suitable prompts, exhibits proficiency in cluster analysis but takes up to 1 hour to create a satisfactory network; see details in Data S2, Supplemental Digital Content, http://links.lww.com/MD/K857.
In contrast, the network can be generated via R through the link[35] on the R platform[34] within 3 minutes, with clicks of [Submit], [1. Refresh], [2. Paste to input box], and [3. Click on me].
2.2.2. Cluster Analysis in R.
The provided relational data[36] are processed using the R platform.[34] The sequence begins with clicking [Submit], succeeded by [1. Refresh], [2. Paste to input box], and [3. Click on me]. This sequence is then repeated once more. Following these steps, R code is generated on the base of the R platform.[34] When this code is input into R, it produces a network graph, as depicted in Data S2, Supplemental Digital Content, http://links.lww.com/MD/K857. This procedure in R efficiently conducts cluster analysis in just 3 minutes. In contrast, ChatGPT takes an entire hour to generate a network that is comparable to satisfaction.
2.2.3. Different features between the 2 networks from ChatGPT_CI and R.
After prompting the request to ChatGPT: Please compare the one I draw in R and give comments on differences and features between the 2 that you produced and mine, the comments will be summarized in results of this study.
2.3. Goal 2: descriptive analytics of articles in Medicine 2023
To visualize the productive entities and journals within the 1974 articles, 4-quadrant radar plots[37] were applied to display the top 10 countries, institutes, departments, and authors (CIDA).
The absolute advantage coefficient (AAC) (see Equations 1 to 3)[38,39] was applied to evaluate the dominance extent for the most influential CIDA in category, journal impact factor and authorship and L-index (CJAL) scores[37] (based on the CJA score[40]) and the L-index[41] to evaluate research achievements (RAs). The Y-index[42,43] based on the 1st and corresponding authors was applied to locate their coordinates on the 4-quadrant radar plot.[37]
| (1) |
| (2) |
| (3) |
where the AAC ratio is determined by the 3 consecutive numbers of values (e.g., top 3 CJAL scores in descending order denoted by A1, A2, and A3 in Eqs. 2 and 3). The ACC ranged from 0 to 1.0, representing the strength of dominance for the top member when compared to the next 2 members. Through the computation of AAC, the dominance strength in a variable (i.e., CIDA) can be measured and judged by the effect size, with criteria of <0.5, between 0.5 and 0.7, and not <0.7 as the small, medium, and large effect sizes, respectively.[38]
A cluster analysis was conducted on the top 20 esteemed journals cited by articles from Medicine 2023. The references corresponded to 1974 local articles, which were sourced from the icite website.[44] Further details can be found in Data S2, Supplemental Digital Content, http://links.lww.com/MD/K857.
2.4. Goal 3: diagnostic analytics of articles in Medicine 2023
The best method chosen from ChatGPT-CI and R was then employed to present a series of visualizations of country-specific author collaborations, rooted in social network and cluster analyses. Visualization techniques incorporating network charts, chord diagrams, circle bar plots, circle packing plots, heat dendrograms, and word clouds were demonstrated, which can be applied to future bibliometrics, but few are seen in traditional professional tools, such as CiteSpace,[12] VOSviewer,[13] Bibexcel,[9] and other specialized bibliometric software.[11]
2.5. Goal 4: prescriptive analytics with timeline visuals in Medicine 2023
2.5.1. Productive authors with articles on timeline visuals.
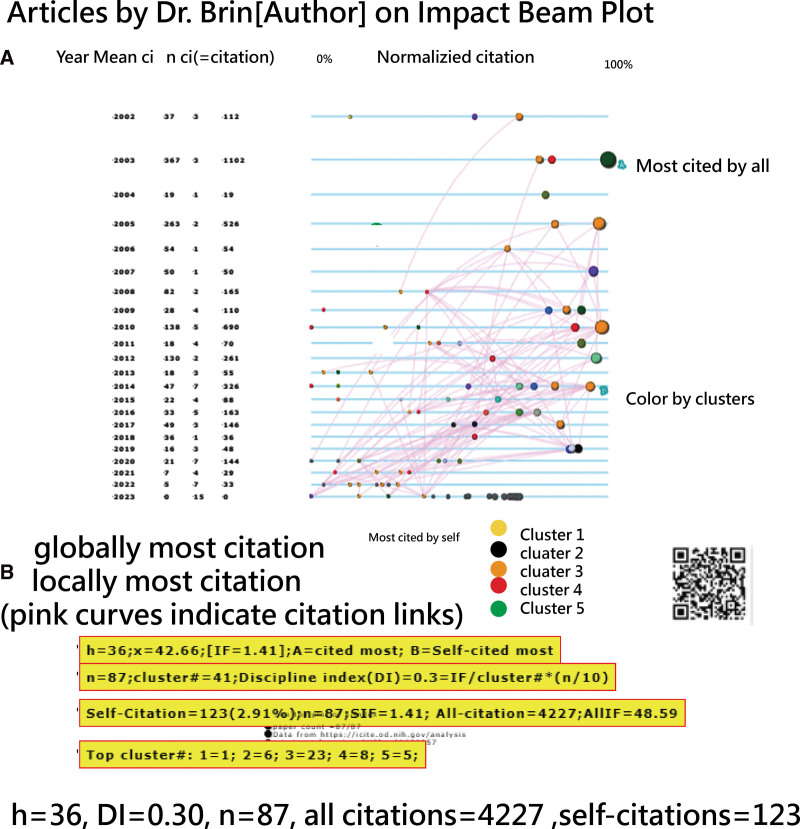
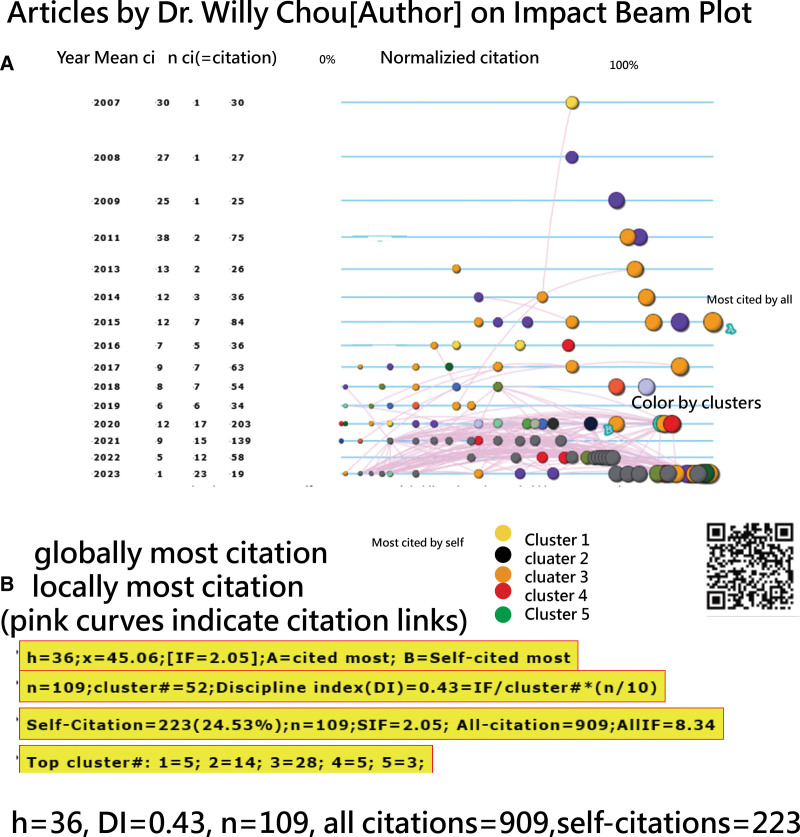
The research profiles of 2 prolific authors yield in descriptive analytics were highlighted using timeline visuals.[22] With the timeline visuals, the most worth-reading articles with more citations were highlighted by the bubble size. The normalized citations are on the horizontal axis, and the publication years are on the vertical axis. The article themes were clustered by their references cited each other using bubble colors for identification. All those articles could be linked to PubMed once the bubble representing an article in timeline visuals was selected and clicked.
2.5.2. Themes assigned to articles on timeline visuals.
Themes based on keywords plus from Web of Science core collection were allocated to the 1976 articles by identifying the primary elements in clusters (or as leaders outlined in the FLCA algorithm[4,17,21,22]). Using the FLCA, a co-word analysis was executed. Subsequent to this, themes were designated to each article, according to earlier research.[45,46]
Following the methodology used in the prior section concerning prolific authors and their article timeline visuals, all articles – including themes, citations, and cited reference counts – were displayed on a timeline visual.[22] This visual places the normalized count of cited references on the x-axis and the themes on the y-axis. Themes within the articles were grouped and color-coded for clarity. Additionally, by selecting and clicking on the bubble representing an article in the timeline visual, users could link directly to the article on PubMed.
2.6. Creating dashboards on Google Maps
All graphs were drawn by author-made modules on the R platform[34] for generating visualizations. We created HTML pages used for Google Maps for 4-quadrant radar plots[37] and timeline visuals.[22] The way to draw the visualization involved in this study is described in Data S2, Supplemental Digital Content, http://links.lww.com/MD/K857.
3. Results
3.1. Different features between the 2 networks from ChatGPT_CI and R
3.1.1. Response from ChatGPT.
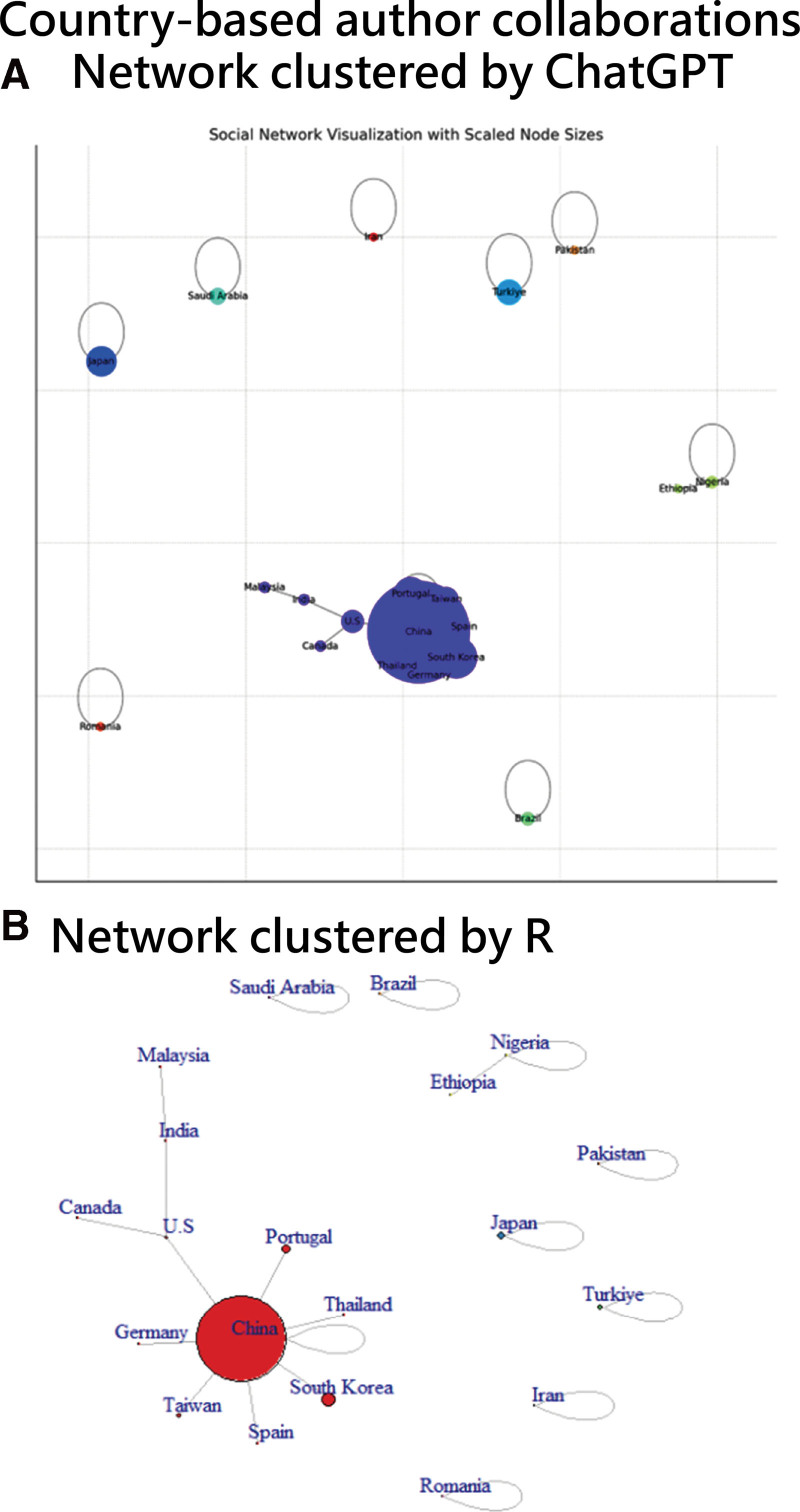
Thank you for sharing your social network visualization created in R. Now that we have both visualizations – yours produced in R (as displayed above) and the one I produced in Python (displayed earlier) – let us compare and comment on the differences and features of the 2.
3.1.2. Summary from ChatGPT in comparison with R.
Both R and Python visualizations of the social network were compared. The R visualization offers an evenly spaced layout, uniform node sizes, and consistent edge thickness and color, resulting in a clean, professional appearance with clear labels. The Python visualization, after adjustments, also achieves clarity with balanced node distribution, scaled node sizes, and neutral edge colors.
Both use color to denote clusters effectively. R’s visualization tools, such as igraph and ggraph, harness its statistical prowess. Python’s visualization employs NetworkX and Matplotlib, popular libraries for network analysis. The choice between R (bottom) and Python (top) in Figure 1 depends on user preference and project specifics.
Figure 1.
Comparison of network charts clustered by ChatGPT (top) and R (bottom).
3.2. Descriptive analytics in 1976 articles
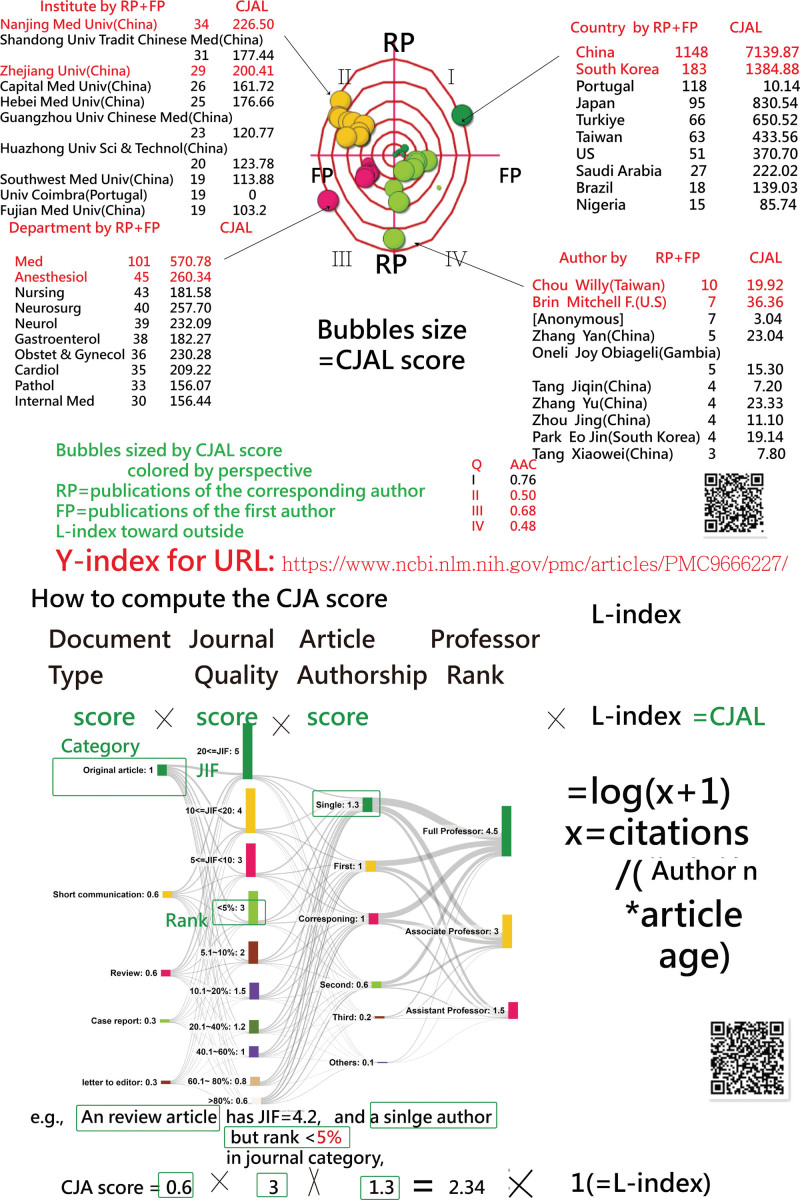
When evaluating the most active contributors in publications by countries, institutions, departments, and individual authors, China, Nanjing Medical University (China), the Medical School Department, and Dr Chou from Taiwan emerged as the top contributors (as shown in Fig. 2). China notably held a dominant position in CJAL scores, significantly surpassing the subsequent elements (with AAC = 0.76 < 0.70). A higher number of corresponding authors were identified from China. In a similar vein, all articles penned by Dr Chou were credited to corresponding authors, as depicted in the fourth quadrant of Figure 2.
Figure 2.
Top 10 article entities with a 4-quadrant radar plot to display dominant contributions in comparison.
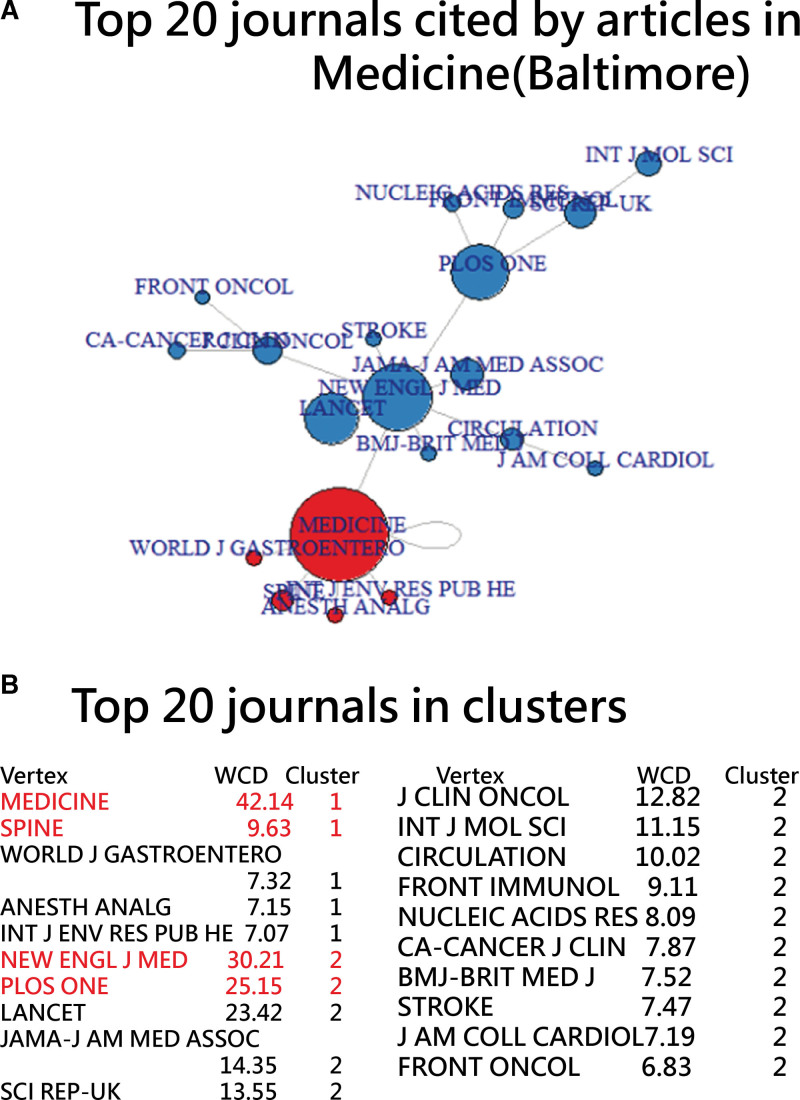
The most cited articles originated from the journals Medicine (Baltimore), New England Journal of Medicine, PLOS ONE, LANCET, and The Journal of the American Medical Association, with respective contributions of 4.53%, 3.25%, 2.7%, 2.52%, and 1.54% (Fig. 3).
Figure 3.
Prestigious journals cited by articles in the Journal of Medicine (Baltimore) in 2023.
3.3. Diagnostic analytics of articles in Medicine 2023
Owing to the time efficiency and the use of larger font sizes in the network visualization with R, we chose the R approach to showcase the subsequent 6 visualizations crafted on the R platform,[34] with the steps shown below:
Click on [submit] after loading the link.[36]
Save the results of the data with 3 columns.
Load the links,[47–53] respectively, and copy and paste the data in Step 2 to the input box on the R platform[34] followed by clicking [Submit], succeeded by [1. Refresh], [2. Paste to input box], and [3. Click on me].
Copy R-code at the bottom of the web page to R to create respective graphs.
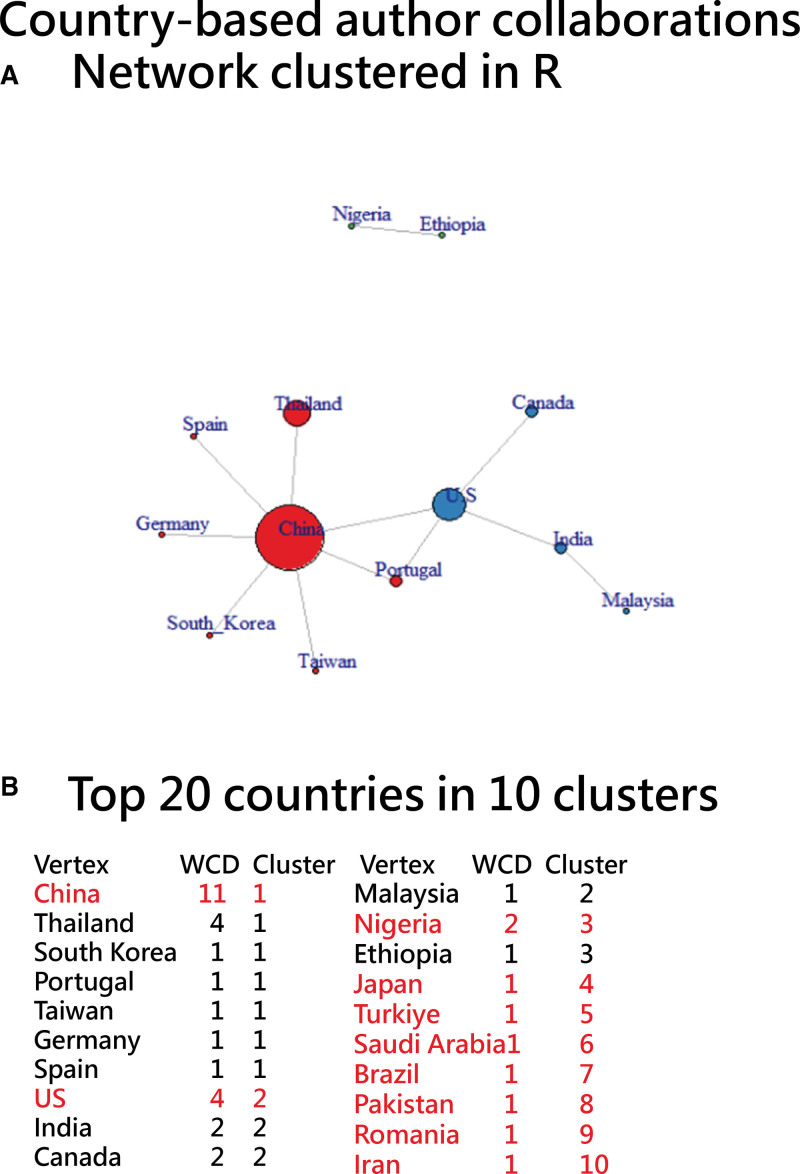
The 7 graphs in Figures 4–10 can be drawn each within 3 minutes using the 4 steps described above.
Figure 4.
Country-based author collaborations using a network chart to display those with links and excluding those isolated entities.
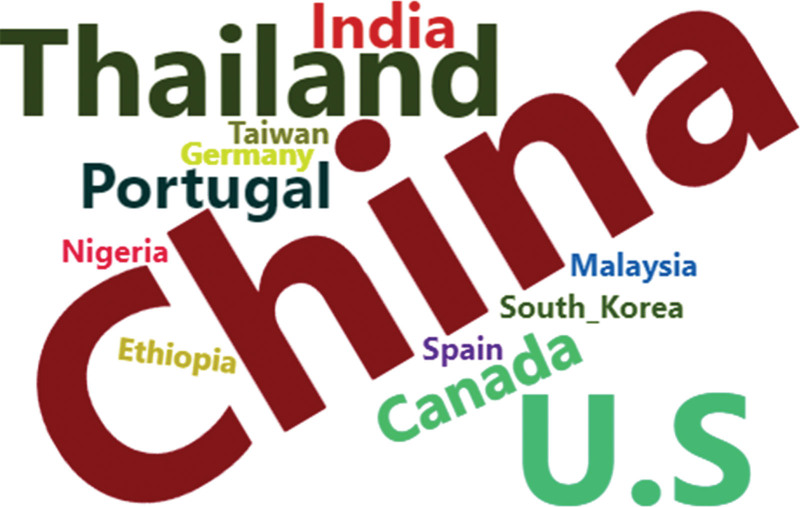
Figure 10.
Country-based author collaborations using word clouds to display.
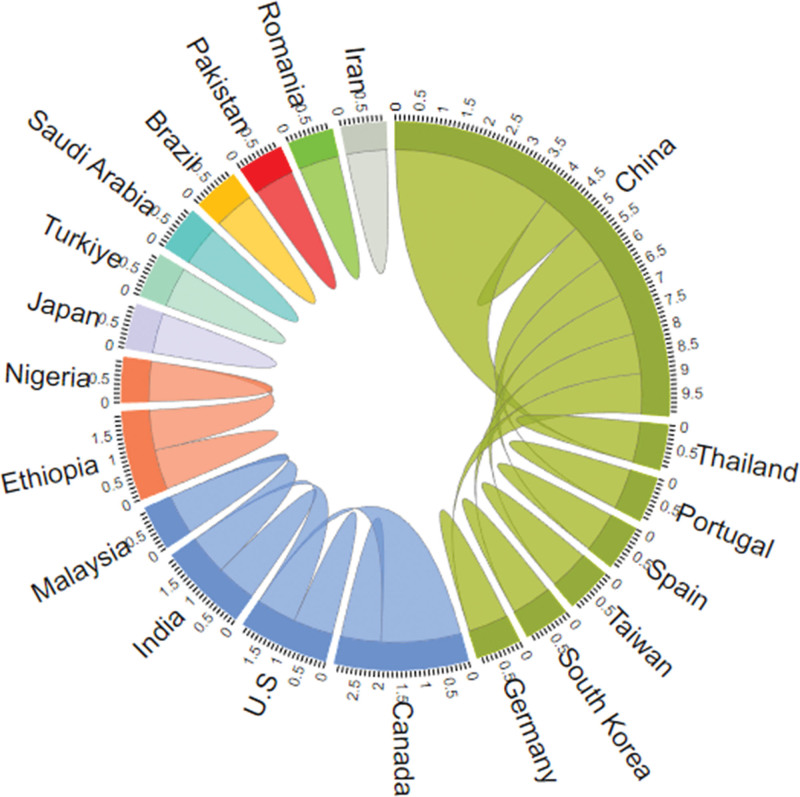
Figure 5.
Country-based author collaborations using a chord diagram to display.
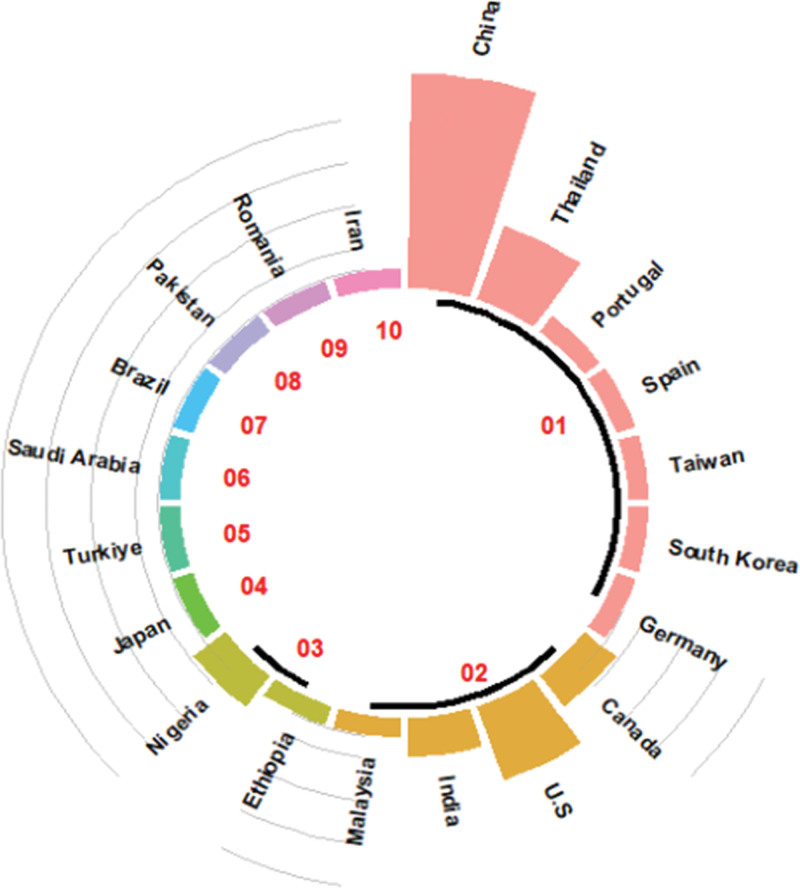
Figure 6.
Country-based author collaborations using a circle bar plot to display.
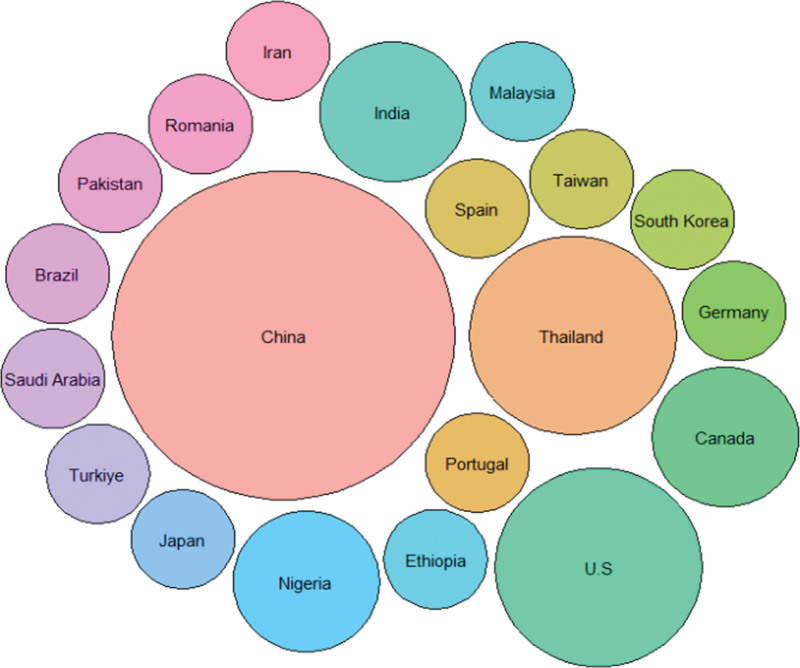
Figure 7.
Country-based author collaborations using a circle packing plot to display.
Figure 8.
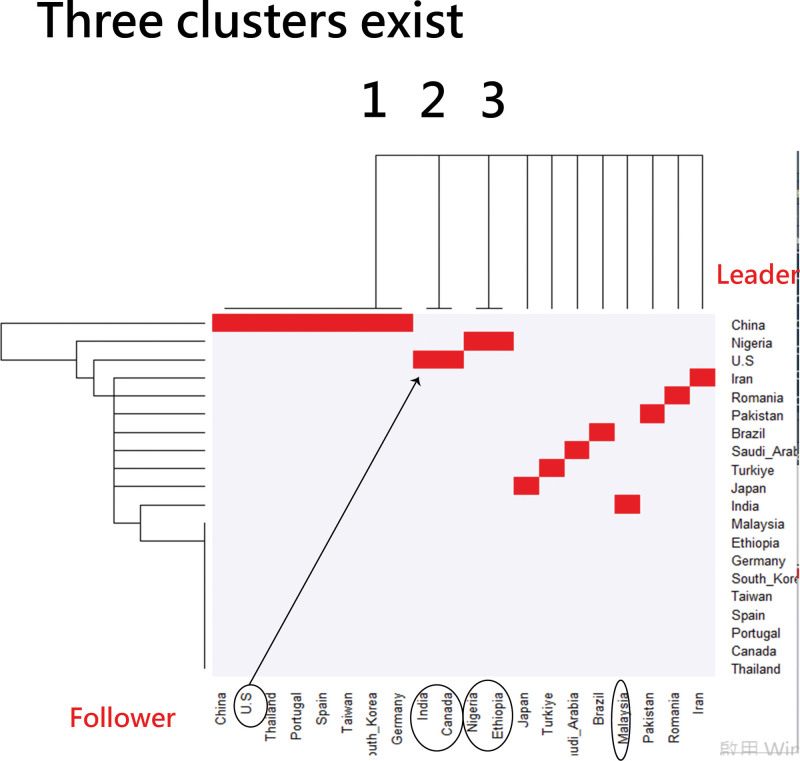
Country-based author collaborations using a heat dendrogram to display (note: leaders are on the last column and followers are on the bottom).
Figure 9.
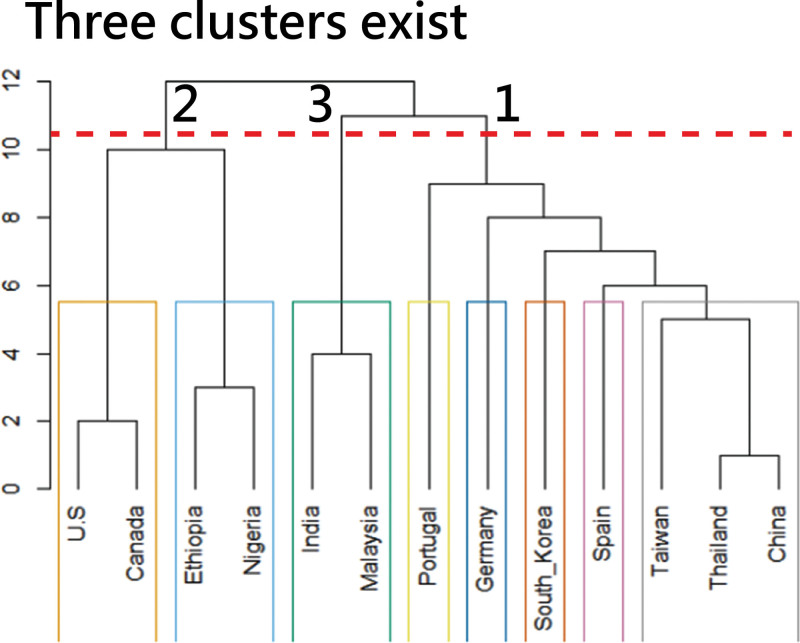
Country-based author collaborations using a dendrogram to display (note: horizontal line at 10.5 to classify 3 clusters, but different results from FLCA algorithm due to distinct algorithm used in this graph).
3.4. Prescriptive analytics to productive authors in Medicine 2023
The timeline visualizations in Figures 11 and 12 depict the research profiles of Dr Brin and Dr Chou. Observations include the following: (1) both share an identical h-index[54] of 36, but Dr Chou x-index[55] is slightly higher at 45.06, compared to Dr Brin at 42.66; (2) Dr Chou discipline index (DI)[22] of 0.39 slightly exceeds Dr Brin DI (=0.30), suggesting varied disciplines within their research teams. A DI,[22] ranging from 0 to 10, indicates that a higher value suggests a more focused research domain and a higher likelihood of the author drafting the manuscript.[22] (3) Dr Brin total citations amount to 4227, significantly surpassing Dr Chou 909. This might explain why Dr Brin CJAL score of 36.36 is higher than Dr Chou score of 19.92, as illustrated in Figure 2.
Figure 11.
Timeline visual showing the research profile of Dr Brin since 2002 in PubMed.
Figure 12.
Timeline visual showing the research profile of Dr Chou since 2007 in PubMed.
The latest papers by Dr Brin and Dr Chou, referenced as,[56,57] are accessible by clicking the rightmost bubbles in 2023. Both articles will be discussed further in the Discussion section.
3.5. Prescriptive analytics to articles in Medicine 2023
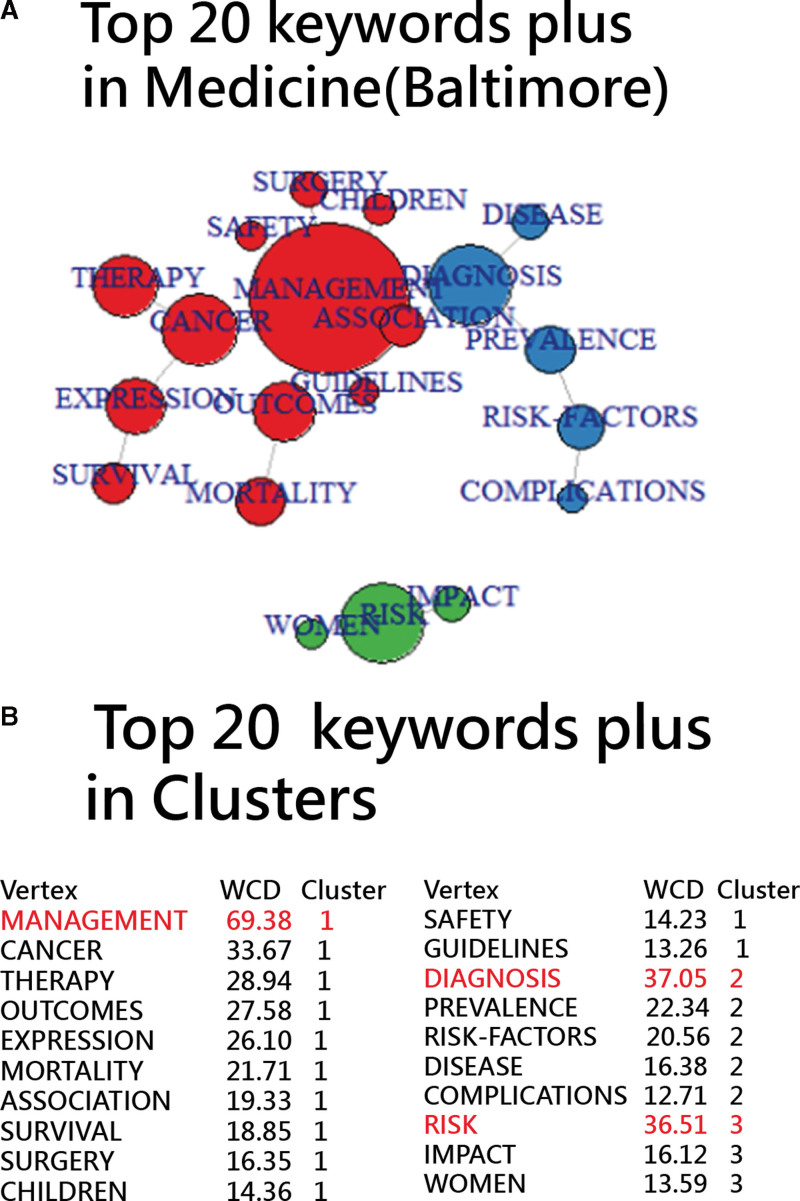
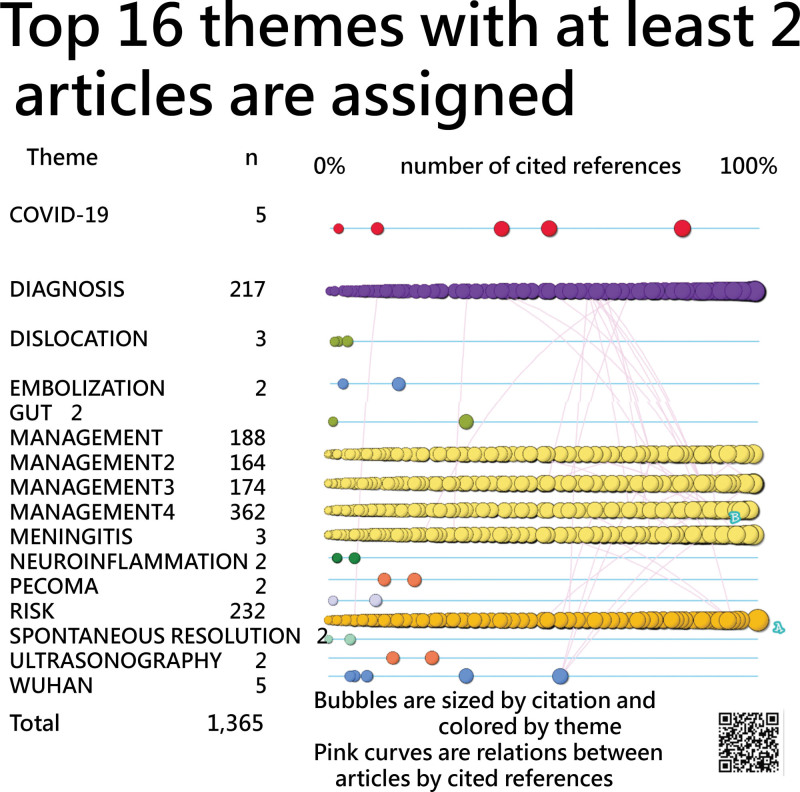
Using the method outlined in Section 3.4, the top 20 “keywords plus” can be grouped into 3 distinct clusters, led by Management, Diagnosis, and Risk. These clusters are visualized on a network chart as depicted in Figure 13. Figure 14 presents a timeline visual that displays 1365 articles under the top 16 themes, each containing at least 2 articles.
Figure 13.
Top 20 keywords plus classified by cluster analysis shown on a network display.
Figure 14.
Timeline visual showing 1365 articles in top 16 themes with at least 2 articles in themes each.
Out of 1973 articles, 575 lack assigned “keywords plus.” Of the rest, 889 are associated with Management, 233 with Risk, and 219 with Diagnosis. Ten articles pertain to COVID-19, while 2 articles each are linked to DISLOCATION and MENINGITIS. Additionally, 6 themes encompass 2 articles each, and 29 themes are represented by just a single article.
Symbol A marks the article with the highest citation count in the Web of Science, while symbol B indicates the article most cited within Medicine 2023. The bubbles are color-coded based on their themes and their size corresponds to the number of references they cite. At a cursory look, it is evident that articles with more cited references (i.e., those positioned further to the right on the horizontal axis) tend to have more citations within Medicine 2023, as indicated by their larger bubble sizes.
3.6. Online dashboards shown on Google Maps
Some graphs[58–61] with the QR codes in graphs are linked to the dashboards if the QR code is scanned. Readers are suggested to examine the details about article information laid on Google Maps.
4. Discussion
4.1. Principal findings
The study’s key insights are as follows: (1) the leading contributors include China, Nanjing Medical University (China), the Medical School Department, and Dr Chou from Taiwan when categorized by countries, institutions, departments, and authors; (2) the most cited articles were from journals such as Medicine (Baltimore), New England Journal of Medicine, PLOS ONE, LANCET, and The Journal of the American Medical Association, contributing 4.53%, 3.25%, 2.7%, 2.52%, and 1.54%, respectively; (3) cluster analysis in R was notably more efficient than ChatGPT_CI, reducing the processing time from an hour to a mere 3 minutes; (4) using R, 6 distinct cluster-based networks were developed on a tailored platform; and (5) timeline visualizations showcased the research paths of 2 distinguished authors(Dr Brin from the U.S. and Dr Chow from Taiwan) and articles themes in Medicine 2023.
Consequently, our study confirms that R provides the most efficient and effective cluster analysis technique when compared to ChatGPT-CI.
4.2. Additional information
4.2.1. ChatGPT_CI and R or Python platform.
The Code Interpreter functionality in ChatGPT offers a promising avenue to make data analysis accessible to those without specialized knowledge.[23] At its essence, the Code Interpreter is a contained Python programming space within ChatGPT, designed for executing a variety of tasks using Python code.[62] However, the terminology and association with coding can deter or confuse many users. While it is named “Code Interpreter” and operates through Python, it is not solely for those well-versed in programming. While having some programming knowledge can enhance its usage, it is not a prerequisite.
While our research indicates that R offers a superior cluster analysis technique compared to ChatGPT-CI, reducing time consumption from an hour to just 3 minutes, this is grounded in the context of using a dedicated R platform. Conversely, if a Python platform were optimized for this task, its efficiency and efficacy in cluster analysis could match that of the R platform.
As experts in bioinformatics, we find its capabilities in data handling and visualization commendable. However, the distinct demands of bioinformatics, such as the need for third-party packages, access to annotated databases, and management of large datasets,[63–66] present challenges.
Given the Code Interpreter’s support solely for Python, its inability to install extra packages, restrictions on using external assets, and confined storage, there are potential barriers to its broad uptake in bioinformatics.[67] To overcome these issues, we recommend the development of locally deployable, API-driven platforms (e.g., R platform[34] used in this study) for chatbot-supported bioinformatics tasks, such as the 6 graphs in Figures 4–10 drawn each within 3 minutes using the 4 steps described in Section 3.3.
4.2.2. Dominant entities in articles published in Medicine 2023.
An earlier study examining articles published in medicine between 2020 and 2021 identified China, Sichuan University (China), the department of internal medicine, and author Qiu Chen from China as the predominant contributors to medicine (Baltimore).[37] While these results differ from our findings (i.e., Nanjing Medical University [China], Medical School, and author Willy Chou from Taiwan, instead), China remains a consistent leader, as evidenced by an AAC increase from 0.71 to 0.76, indicating a progressively dominant role.
4.3. The worthy reading articles
The latest papers by Dr Brin and Dr Chou, referenced as,[56,57] are abstracted below:
The article[56] was authored by Dr Brin and his colleagues. In abstract, botulinum neurotoxins are multidomain proteins that bind to gangliosides and proteins associated with nerve cell membranes and cleave one or more SNARE proteins. BoNT molecules have undergone several modifications to help identify the protein domains responsible for various aspects of BoNT action, such as localized effects and increased specificity for autonomic or sensory neurons. New formulations of BoNTs are under investigation for both patients and physicians, and novel clinical uses are being evaluated for onabotulinum toxin A.
Another article[57] was authored by Dr Chou and his colleagues. In the abstract, this study uses the inflection point (IP) to interpret the burst spot feature in the temporal bar graph (TBG) to better understand the evolution of a topic (e.g., publications and citations for a given author). The EISTL model was proposed to demonstrate the TBG as a whole, and a dashboard on Google Maps was designed and launched for bibliometric analysis. Four authors were recruited to compare their research achievements shown on the TBG. The highest burst strengths in publication and citations were earned by Barry Halliwell and Jean-Pierre Changeux.
4.4. Implications and possible changes
This research provides valuable insights for the academic community and researchers through a comprehensive bibliometric analysis. The study introduces the R platform[34] that generates R code for visualizations within 3 minutes each, which confirms that R provides the most efficient and effective cluster analysis technique when compared to ChatGPT-CI.
One of the most notable features of this research is its use of the FLCA algorithm to cluster entities. This method helps to improve our understanding of the dynamics of the field by providing a simple but clear visualization of the top 20 entities, displayed with 6 types of visual displays.
SNA[1,2] is often used to examine the connections within a network (e.g., used for author collaborations and keyword co-occurrences). However, its primary goal is to understand the network’s architecture and its inherent dynamics. Cluster analysis is a statistical method that is designed to categorize similar items based on their attributes. This ensures that there are similarities within clusters and differences between clusters (e.g., theme analysis referred to Fig. 14 in bibliometrics or).
In this research, SNA and cluster analysis were used together to provide a more comprehensive understanding of the research landscape. For example, after visualizing the relationships between individuals in a social network, cluster analysis was used to identify tight-knit communities within that network (e.g., author collaborations or coword cooccurrences). With clear and concise views of the top 20 elements(e.g., Figs. 4–10 and 13), we overcome the traditional SNA problem of clustered and overburdened nodes.
The timeline visuals in Figures 11 and 12 present much more information in research profiles for specific authors, such as the 2 authors’ research teams are multidisciplinary, the 2 are more in corresponding authors, and articles are clustered based on cited articles each other in research profiles, which are unique and modern when compared to the impact bean plot.[68] Conversely, the timeline representation in Figure 14 is derived from the CiteSpace software.[12] We illustrated the method for creating this timeline visualization, assuming that themes have already been categorized through cluster analysis, as done using the FLCA algorithm[4,17,21,22] in this research.
4.5. Limitations and suggestions
This study is rigorous in its approach, yet it is not without certain limitations:
First, ChatGPT-CI operates based on prompts given by authors. When supplied with appropriate prompts, the efficiency of ChatGPT in producing network charts can be enhanced, potentially reducing the time needed, as seen in this study, where it took less than an hour.
Second, if a Python platform were established, its efficiency in creating visual displays could rival those generated using the R platform. This comparison was not made in this study since such a Python platform is not currently available.
Third, this study only briefly touches on journals related to medicine (Baltimore) based on articles cited in Medicine 2023. This is because the primary focus of the research is on comparing visuals generated in ChatGPT-CI and R, rather than delving into the prominent journals associated with the target journal.
Fourth, the visual representations in the research could benefit from enhancements, such as color-coded bubbles delineated by their clusters and size adjustments consistent with weighted centrality degree[69,70] (e.g., using the statement of deg <- degree(network, mode=“all”) in R to yield connection counts in the network).
Fifth, FLCA’s uniqueness is not solely relative to SNA in CiteSpace,[12] VOSviewer,[13] Bibexcel,[9] and others.[11] For a more nuanced comprehension of the FLCA applied to the R platform[34] (such as those referenced at link[71] and in Data S2, Supplemental Digital Content, http://links.lww.com/MD/K857), refinements are essential in subsequent studies.
Sixth, the demonstration of the network diagrams utilized to accentuate diagnostic analytics results is cursory based on country-based author collaborations only. A more detailed exposition of these displays would be advantageous in other coword analyses, as we demonstrated in Figure 13 using the FLCA algorithm.
Last, the R platform,[34] employed for crafting the visualizations in this research, has room for enhancement, particularly regarding its usability and interface design.
5. Conclusion
In evaluating cluster analysis techniques using ChatGPT versus R-Language, this study analyzed author collaborations and keyword cooccurrences on articles from the Journal of Medicine (Baltimore) 2023. The research revealed R’s superiority in efficiency and effectiveness, condensing data visualization time from an hour to mere minutes compared to ChatGPT_CI.
The most active contributors were pinpointed, with China and Dr Chou from Taiwan leading in their categories. The most cited articles originated from the following journals: Medicine (Baltimore), New England Journal of Medicine, PLOS ONE, LANCET, and The Journal of the American Medical Association.
The study successfully mapped out collaboration networks and showcased the research trajectories of 2 eminent authors, providing a comprehensive bibliometric analysis.
Acknowledgments
We thank Enago (www.enago.tw) for the English language review of this manuscript.
Author contributions
Conceptualization: Yung-Ze Cheng.
Data curation: Tzu-Han Lai.
Investigation: Willy Chou.
Methodology: Tsair-Wei Chien.
Supplementary Material
Abbreviations:
- AAC
- absolute advantage coefficient
- CIDA
- country, institute, department, and author
- CJAL
- category, journal impact factor and authorship and L-index
- FLCA
- follower-leading clustering algorithm
- SNA
- social network analysis
- WoSCC
- Web of Science core collection
The datasets generated during and/or analyzed during the current study are publicly available.
Supplemental Digital Content is available for this article.
The authors have no funding and conflicts of interest to disclose.
How to cite this article: Cheng Y-Z, Lai T-H, Chien T-W, Chou W. Evaluating cluster analysis techniques in ChatGPT versus R-language with visualizations of author collaborations and keyword cooccurrences on articles in the Journal of Medicine (Baltimore) 2023: Bibliometric analysis. Medicine 2023;102:49(e36154).
Contributor Information
Yung-Ze Cheng, Email: asaliea.cheng@gmail.com.
Tzu-Han Lai, Email: emilyzihan818@gmail.com.
Tsair-Wei Chien, Email: smile@mail.chimei.org.tw.
References
- [1].Ho SY, Chien TW, Huang CC, et al. A comparison of 3 productive authors’ research domains based on sources from articles, cited references and citing articles using social network analysis. Medicine (Baltim). 2022;101:e31335. [DOI] [PMC free article] [PubMed] [Google Scholar]
- [2].Yie KY, Chien TW, Yeh YT, et al. Using Social Network analysis to identify spatiotemporal spread patterns of COVID-19 around the World: online dashboard development. Int J Environ Res Public Health. 2021;18:2461. [DOI] [PMC free article] [PubMed] [Google Scholar]
- [3].Yang ACH, Chaudhury H, Ho JCF, et al. Measuring the impact of bedroom privacy on social networks in a long-term care facility for Hong Kong older adults: a spatio-social network analysis approach. Int J Environ Res Public Health. 2023;20:5494. [DOI] [PMC free article] [PubMed] [Google Scholar]
- [4].Cheng TY, Ho SY, Chien TW, et al. A comprehensive approach for clustering analysis using follower-leading clustering algorithm (FLCA): bibliometric analysis. Medicine (Baltimore). 2023;102:e35156. [DOI] [PMC free article] [PubMed] [Google Scholar]
- [5].Trach R, Khomenko O, Trach Y, et al. Application of fuzzy logic and SNA tools to assessment of communication quality between construction project participants. Sustainability. 2023;15:5653. [Google Scholar]
- [6].Bastian M, Heymann S, Jacomy M. Gephi: an open source software for exploring and manipulating networks. Proceedings of the International AAAI Conference on Web and Social Media. 2009;3:361–2. [Google Scholar]
- [7].Python Software Foundation. Python Language Reference, version 3.10. Available at: https://docs.python.org/3/. [access date Mar 3, 2023].
- [8].R Core Team. R: a language and environment for statistical computing. R Foundation for Statistical Computing, Vienna, Austria. Available at: https://www.R-project.org/. [access date Mar 3, 2023].
- [9].Persson O. Analyzing bibliographic data to visualize representations. Available at: https://homepage.univie.ac.at/juan.gorraiz/bibexcel/. [access date March 3, 2023].
- [10].Aishwaryasum. Top 10 social network analysis tools to consider. Available at: https://www.geeksforgeeks.org/top-10-social-network-analysis-tools-to-consider/. [access date March 3, 2023].
- [11].Tomaszewski R. Visibility, impact, and applications of bibliometric software tools through citation analysis. Scientometrics. 2023;128:4007–28. [DOI] [PMC free article] [PubMed] [Google Scholar]
- [12].Ping Q, He J, Chen C. How many ways to use CiteSpace? A study of user interactive events over 14 months. J Assoc Inf Sci Technol. 2017;68:1234–56. [Google Scholar]
- [13].van Eck NJ, Waltman L. “Software survey: VOSviewer, a computer program for bibliometric mapping”. Scientometrics. 2010;84:523–38. [DOI] [PMC free article] [PubMed] [Google Scholar]
- [14].Hu S, Xu S, Lu W, et al. The research on the treatment of primary immunodeficiency diseases by hematopoietic stem cell transplantation: a bibliometric analysis from 2013 to 2022. Medicine (Baltim). 2023;102:e33295. [DOI] [PMC free article] [PubMed] [Google Scholar]
- [15].Cheng H, Lin L, Liu T, et al. Financial toxicity of breast cancer over the last 30 years: a bibliometrics study and visualization analysis via CiteSpace. Medicine (Baltim). 2023;102:e33239. [DOI] [PMC free article] [PubMed] [Google Scholar]
- [16].Lin CK, Ho SY, Chien TW, et al. Analyzing author collaborations by developing a follower-leader clustering algorithm and identifying top coauthoring countries: cluster analysis. Medicine (Baltim). 2023;102:e34158. [DOI] [PMC free article] [PubMed] [Google Scholar]
- [17].Chien TW, Wang HY, Kan WC, et al. Whether article types of a scholarly journal are different in cited metrics using cluster analysis of MeSH terms to display: a bibliometric analysis. Medicine (Baltim). 2019;98:e17631. [DOI] [PMC free article] [PubMed] [Google Scholar]
- [18].Neptune. Exploring Clustering Algorithms: Explanation and Use Cases. Available at: https://neptune.ai/blog/clustering-algorithms. [access date August 22, 2023].
- [19].Bu D, Zhao Y, Cai L, et al. Topological structure analysis of the protein–protein interaction network in budding yeast. Nucleic Acids Res. 2003;31:2443–50. [DOI] [PMC free article] [PubMed] [Google Scholar]
- [20].Leydesdorff L, Bornmann L, Wagner CS. Generating clustered journal maps: an automated system for hierarchical classification. Scientometrics. 2017;110:1601–14. [DOI] [PMC free article] [PubMed] [Google Scholar]
- [21].Yen PC, Chou W, Chien TW, et al. Analyzing fulminant myocarditis research trends and characteristics using the follower-leading clustering algorithm (FLCA): a bibliometric study. Medicine (Baltimore). 2023;102:e34169. [DOI] [PMC free article] [PubMed] [Google Scholar]
- [22].Cheng YZ, Chien TW, Ho SY, et al. Visual impact beam plots: analyzing research profiles and bibliometric metrics using the following-leading clustering algorithm (FLCA). Medicine (Baltimore). 2023;102:e34301. [DOI] [PMC free article] [PubMed] [Google Scholar]
- [23].ChatGPT. Available at: https://opneai.com/blog.chatgpt. [access date August 23, 2023].
- [24].Ipsen A. How to use ChatGPT’s new “Code Interpreter” feature. Available at: https://www.pluralsight.com/resources/blog/data/chatgpt-code-interpreter-plugin-guide. [access date August 23, 2023].
- [25].Block JH, Fisch C. Eight tips and questions for your bibliographic study in business and management research. Manag Rev Q. 2020;70:307–12. [Google Scholar]
- [26].Pubmed. Articles related to bibliometrics. Available at: https://pubmed.ncbi.nlm.nih.gov/?term=bibliometric%5BMeSH%20Major%20Topic%5D&sort=pubdate&timeline=expanded. [access date Aug 22, 2023].
- [27].Pubmed. Articles related to meta-analysis. Available at: https://pubmed.ncbi.nlm.nih.gov/?term=meta-analysis%5BMeSH%20Major%20Topic%5D&sort=pubdate&timeline=expanded. [access date August 22, 2023].
- [28].Moreno-Morente G, Hurtado-Pomares M, Terol Cantero MC. Bibliometric analysis of research on the use of the Nine Hole Peg Test. Int J Environ Res Public Health. 2022;19:10080. [DOI] [PMC free article] [PubMed] [Google Scholar]
- [29].Zhu H, Shi L, Wang R, et al. Global research trends on infertility and psychology from the past two decades: a bibliometric and visualized study. Front Endocrinol (Lausanne). 2022;13:889845. [DOI] [PMC free article] [PubMed] [Google Scholar]
- [30].Yacouba A, Olowo-Okere A. Global trends and current status in colistin resistance research: a bibliometric analysis (1973–2019). F1000Res. 2020;9:856. [DOI] [PMC free article] [PubMed] [Google Scholar]
- [31].Valera-Gran D, Prieto-Botella D, Peral-Gómez P, et al. Bibliometric analysis of research on telomere length in children: a review of scientific literature. Int J Environ Res Public Health. 2020;17:4593. [DOI] [PMC free article] [PubMed] [Google Scholar]
- [32].Martynov I, Klima-Frysch J, Schoenberger J. A scientometric analysis of neuroblastoma research. BMC Cancer. 2020;20:486. [DOI] [PMC free article] [PubMed] [Google Scholar]
- [33].Aria M, Cuccurullo C. Bibliometrix: an R-tool for comprehensive science mapping analysis. J Inf. 2017;11:959–75. [Google Scholar]
- [34].Chien TW. To generate R language for visualizations. Available at: https://www.healthup.org.tw/raschonline/cbp.asp. [access date August 23, 2023].
- [35].Chien TW. Data uploaded to ChatGPT for crafting network. [access date August 23, 2023].
- [36].Chien TW. Data uploaded to ChatGPT for crafting network. Available at: https://www.healthup.org.tw/raschonline/medicine2023.htm. [access date August 23, 2023].
- [37].Shao Y, Chien TW, Jang FL. The use of radar plots with the Yk-index to identify which authors contributed the most to the Journal of Medicine in 2020 and 2021: A bibliometric analysis. Medicine (Baltimore). 2022;101:e31033. [DOI] [PMC free article] [PubMed] [Google Scholar]
- [38].Yang TY, Chien TW, Lai FJ. Citation analysis of the 100 top-cited articles on the topic of hidradenitis suppurativa since 2013 using Sankey diagrams: Bibliometric analysis. Medicine (Baltimore). 2022;101:e31144. [DOI] [PMC free article] [PubMed] [Google Scholar]
- [39].Yang DH, Chien TW, Yeh YT, et al. Using the absolute advantage coefficient (AAC) to measure the strength of damage hit by COVID-19 in India on a growth-share matrix. Eur J Med Res. 2021;26:61. [DOI] [PMC free article] [PubMed] [Google Scholar]
- [40].Yeh JT, Shulruf B, Lee HC, et al. Faculty appointment and promotion in Taiwan’s medical schools, a systematic analysis. BMC Med Educ. 2022;22:356. [DOI] [PMC free article] [PubMed] [Google Scholar]
- [41].Belikov AV, Belikov VV. A citation-based, author- and age-normalized, logarithmic index for evaluation of individual researchers independently of publication counts. F1000Research. 2015;4:884. [Google Scholar]
- [42].Ho YS. Bibliometric analysis of adsorption technology in environmental science. J Environ Prot Sci. 2007;1:1–11. [Google Scholar]
- [43].Ho YS, Satoh H, Lin SY. Japanese lung cancer research trends and performance in science citation index. Intern Med. 2010;49:2219–28. [DOI] [PubMed] [Google Scholar]
- [44].Icite. Articles indexed in Pubmed were extracted and analyzed. Available at: https://icite.od.nih.gov/. [access date August 24, 2023].
- [45].Chiang HY, Lee HF, Hung YH, et al. Classification and citation analysis of the 100 top-cited articles on nurse resilience using chord diagrams: a bibliometric analysis. Medicine (Baltimore). 2023;102:e33191. [DOI] [PMC free article] [PubMed] [Google Scholar]
- [46].Liu PC, Lu Y, Lin HH, et al. Classification and citation analysis of the 100 top-cited articles on adult spinal deformity since 2011: a bibliometric analysis. J Chin Med Assoc. 2022;85:401–8. [DOI] [PubMed] [Google Scholar]
- [47].Chien TW. Figure 4 produced in this study. Available at: https://www.healthup.org.tw/raschonline/cbp.asp?cbp=Authorcorrence9A. [access date August 23, 2023].
- [48].Chien TW. Figure 5 produced in this study. Available at: https://www.healthup.org.tw/raschonline/cbp.asp?cbp=Authorcorrence3. [access date August 23, 2023].
- [49].Chien TW. Figure 6 was produced in this study. Available at: https://www.healthup.org.tw/raschonline/cbp.asp?cbp=Authorcorrence4. [access date August 23, 2023].
- [50].Chien TW. Figure 7 was produced in this study. Available at: https://www.healthup.org.tw/raschonline/cbp.asp?cbp=Authorcorrence5. [access date August 23, 2023].
- [51].Chien TW. Figure 8 was produced in this study. Available at: https://www.healthup.org.tw/raschonline/cbp.asp?cbp=Authorcorrence6. [access date August 23, 2023].
- [52].Chien TW. Figure 9 was produced in this study. Available at: https://www.healthup.org.tw/raschonline/cbp.asp?cbp=Wordcloud. [access date August 23, 2023].
- [53].Chien TW. Figure 10 produced in this study. Available at: https://www.healthup.org.tw/raschonline/cbp.asp?cbp=Authorcorrence31. [access date August 23, 2023].
- [54].Hirsch JE. An index to quantify an individual’s scientific research output. Proc Natl Acad Sci U S A. 2005;102:16569–72. [DOI] [PMC free article] [PubMed] [Google Scholar]
- [55].Fenner T, Harris M, Levene M, et al. A novel bibliometric index with a simple geometric interpretation. PLoS One. 2018;13:e0200098. [DOI] [PMC free article] [PubMed] [Google Scholar]
- [56].Brideau-Andersen A, Dolly JO, Brin MF. Botulinum neurotoxins: future innovations. Medicine (Baltimore). 2023;102:e32378. [DOI] [PMC free article] [PubMed] [Google Scholar]
- [57].Ho SY, Chien TW, Chou W. Visualizing burst spots on research for four authors in MDPI journals named to be Citation Laureates 2021 using temporal bar graph. Medicine (Baltimore). 2023;102:e34578. [DOI] [PMC free article] [PubMed] [Google Scholar]
- [58].Chien TW. Figure 2 in this study. Available at: https://www.healthup.org.tw/gps/medicine2023radar.htm. [access date August 23, 2023].
- [59].Chien TW. Figure 11 in this study. Available at: https://www.healthup.org.tw/gps/medicine2023radarBrin.htm. [access date August 23, 2023].
- [60].Chien TW. Figure 12 in this study. Available at: https://www.healthup.org.tw/gps/medicine2023radarwillychou.htm. [access date August 23, 2023].
- [61].Chien TW. Figure 14 in this study. Available at: https://www.healthup.org.tw/gps/chatmedicinethemes.htm. [access date September 7, 2023].
- [62].Timothy M. What is the ChatGPT code interpreter? Why is it so important? Available at: https://www.makeuseof.com/what-is-chatgpt-code-interpreter/. [access date August 23, 2023].
- [63].Merow C, Serra-Diaz JM, Enquist BJ, et al. AI chatbots can boost scientific coding. Nat Ecol Evol. 2023;7:960–2. [DOI] [PubMed] [Google Scholar]
- [64].Perkel JM. Six tips for better coding with ChatGPT. Nature. 2023;618:422–3. [DOI] [PubMed] [Google Scholar]
- [65].Shue E, Liu L, Li B, et al. Empowering beginners in bioinformatics with ChatGPT. Quant Biol. 2023;11:105–8. [DOI] [PMC free article] [PubMed] [Google Scholar]
- [66].Xu D. ChatGPT opens a new door for bioinformatics. Quant Biol. 2023;11:204–6. [DOI] [PMC free article] [PubMed] [Google Scholar]
- [67].Wang L, Ge X, Liu L, et al. Code Interpreter for Bioinformatics: Are We There Yet? [published online ahead of print, 2023 Jul 23]. Ann Biomed Eng. 2023. doi: 10.1007/s10439-023-03324-9. Available at: https://pubmed.ncbi.nlm.nih.gov/37482573/ [DOI] [PubMed]
- [68].Author impact beam plots in Web of Science author records. Available at: https://www.youtube.com/watch?v=dcXgx5wxUp4. [access date August 20, 2023].
- [69].Wu JW, Yan YH, Chien TW, et al. Trend and prediction of citations on the topic of neuromuscular junctions in 100 top-cited articles since 2001 using a temporal bar graph: a bibliometric analysis. Medicine (Baltimore). 2022;101:e30674. [DOI] [PMC free article] [PubMed] [Google Scholar]
- [70].Ho SY, Chien TW, Chou W. Visualizing burst spots on research for four authors in MDPI journals named to be Citation Laureates 2021 using temporal bar graph. Medicine (Baltimore). 2023;102:e34578. [DOI] [PMC free article] [PubMed] [Google Scholar]
- [71].Chien TW. How to generate R code on R platform. Available at: https://youtu.be/vWWfff2bru8. [access date Aug 24, 2023].
Associated Data
This section collects any data citations, data availability statements, or supplementary materials included in this article.


