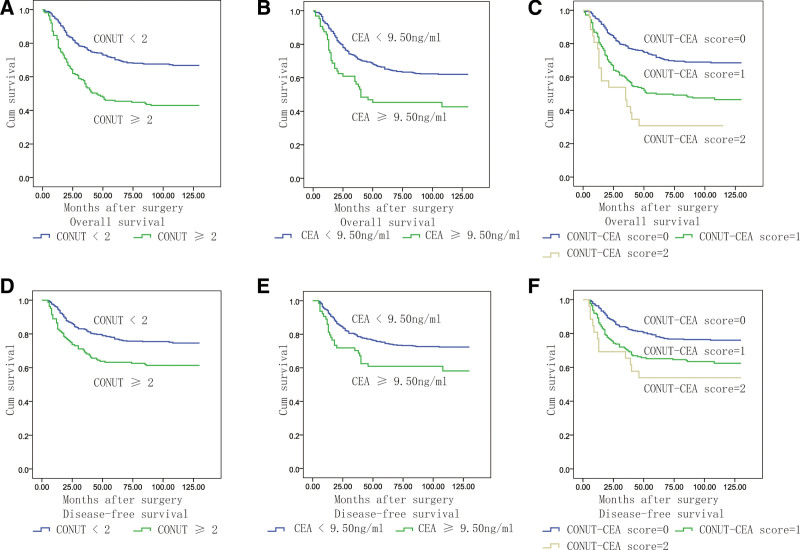
Figure 3.
Kaplan–Meier analysis of the effects of each variable on OS and DFS. A: The OS curves of patients with different CONUT score. B: The OS curves of patients with different CEA score. C: The OS curves of patients with different CONUT-CEA score. D: The DFS curves of patients with different CONUT score. E: The DFS curves of patients with different CEA score. F: The DFS curves of patients with different CONUT-CEA score. CEA = carcinoembryonic antigen, CONUT = controlling nutritional status, DFS = disease-free status, OS = overall survival.

