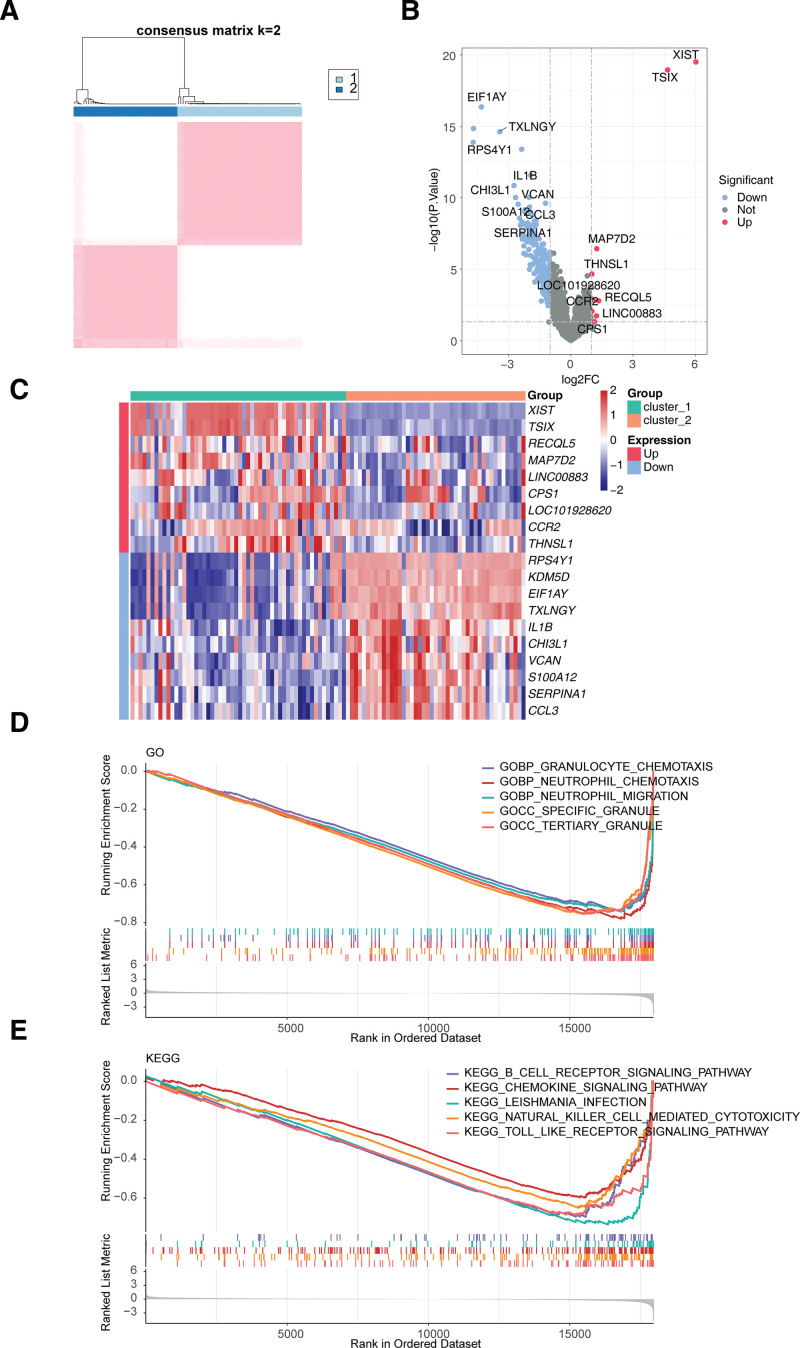
Figure 3.
Consistency clustering analysis to obtain 2 SLC-related subtypes. (A) Clustering matrix for AMI cohorts in GSE66360 when k = 2. (B) Volcano plot and (C) Heatmap of 247 DEGs between cluster 1 and cluster 2. (D, E) Gene set enrichment analysis (GSEA) results of 247 DEGs based on the (D) GO and (E) KEGG gene sets. AMI = acute myocardial infarction. DEGs = differentially expressed genes, KEGG = Kyoto Encyclopedia of Genes and Genomes.

