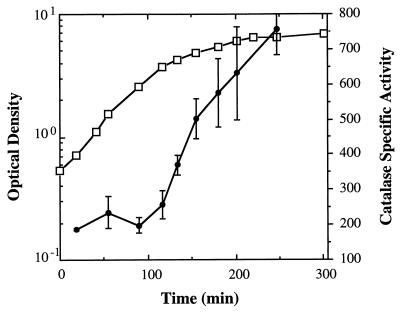
FIG. 2.
Catalase specific activity during the growth of V. fischeri ES114. The average optical density of the cultures is indicated by open squares; catalase specific activity, reported in units/milligram of protein, is designated by black circles. The data are averages of activity assays performed on extracts of triplicate cultures. The error bars are equal to 1 standard deviation.

