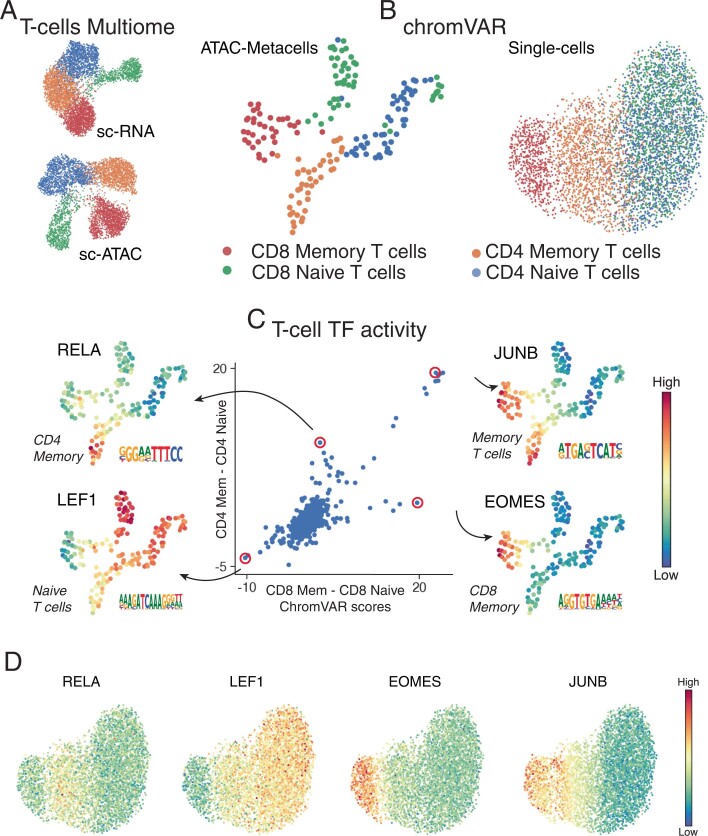
Extended Data Fig. 5. Single-cell chromVAR scores for T-cell subsets.
A. RNA and ATAC UMAPs of the T-cell subset from the PBMC multiome dataset. B. UMAPs derived from chromVAR scores computed using single cells or metacell aggregates. All peaks were used for chromVAR analysis. Metacell chromVAR scores accurately recapitulate differences between T-cell subsets, whereas single-cell chromVAR scores fail to distinguish CD4+ and CD8+ T-cells. C. chromVAR score distributions can be used to identify key TFs that define different T-cell compartments. Each dot represents a TF. X-axis shows the difference between SEACells metacell chromVAR scores between the two CD8+ compartments. Y-axis shows the difference between SEACells metacell chromVAR scores between the two CD4+ compartments. D. UMAPs of T-cell subsets from PBMC multiome data (as in B) colored by single-cell chromVAR scores of key T-cell factors.

