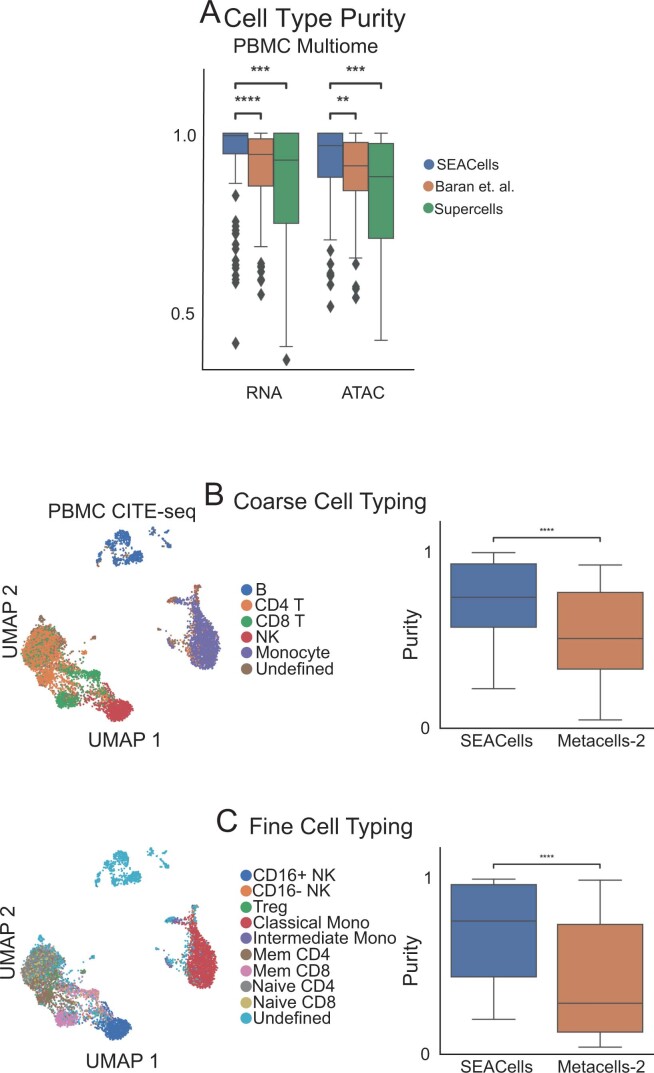
Extended Data Fig. 6. Comparison of RNA metacells to surface protein defined cell-types.
A. Metacell cell-type purity (fraction of the maximally represented cell-type amongst the cells assigned to a metacell) computed by different methods on PBMC data. Wilcoxon rank-sum test was used to assess the significance of differences (** 0.001 < P < 0.01, *** 0.0001 < P < 0.0001, **** P < 0.0001). B. Left: UMAPs of 10x Genomics PBMC CITE-seq dataset5, colored by coarse cell-types. Right: Comparison of cell-type purity between SEACells and MetaCell-2 metacells. Metacells were identified using the RNA modality whereas cell types were determined using cell-surface protein profiles. C. Same as (A), for finer resolution cell-types. Box plots display median, 25th(Q1) and 75th (Q3) percentiles; whiskers extend to the furthest datapoint within the range 1.5 *(Q3-Q1); points beyond that are denoted as outliers. Number of metacells = 109.

