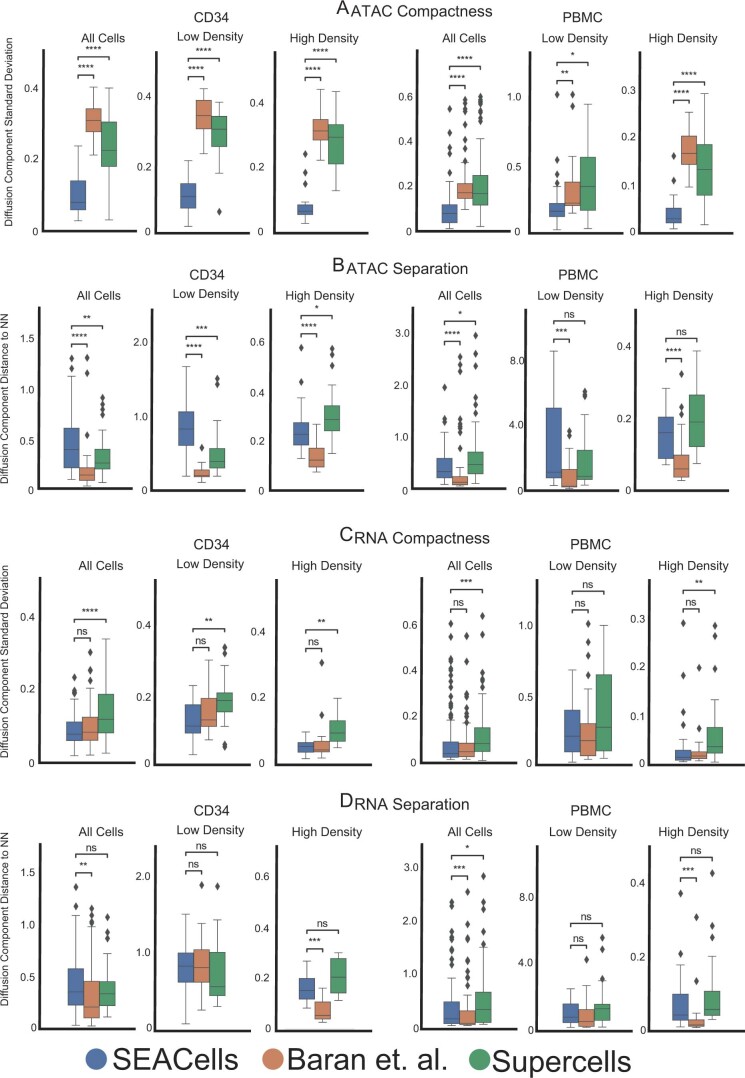
Extended Data Fig. 7. Performance of different approaches in achieving metacell compactness and separation.
A. Metacell compactness (average diffusion component standard deviation; Methods) measured in the ATAC modality of CD34+ and PBMC multiome data. A lower score indicates more compact metacells. Number of metacells = 86 (CD34), 98 (PBMC). B. Metacell separation (distance between nearest metacell neighbor in diffusion space; Methods) measured in the ATAC modality of CD34+ and PBMC multiome data. Larger separation indicates better performance. Number of metacells = 86 (CD34), 98 (PBMC). C. Metacell compactness measured in the RNA modality of CD34+ and PBMC multiome data. Number of metacells = 65 (CD34), 98 (PBMC). D. Metacell separation measured in the RNA modality of CD34+ and PBMC multiome data. Larger separation indicates better performance. Number of metacells = 65 (CD34), 98 (PBMC). Comparisons were carried out on all metacells, or metacells in low-density or high-density regions. Two-sided Wilcoxon rank-sum test; ns: P > 0.05, * 0.01 < P < 0.05, ** 0.001 < P < 0.01, *** 0.0001 < P < 0.0001, **** P < 0.0001. Box plots display median, 25th(Q1) and 75th (Q3) percentiles; whiskers extend to the furthest datapoint within the range 1.5 *(Q3-Q1); points beyond that are denoted as outliers.

