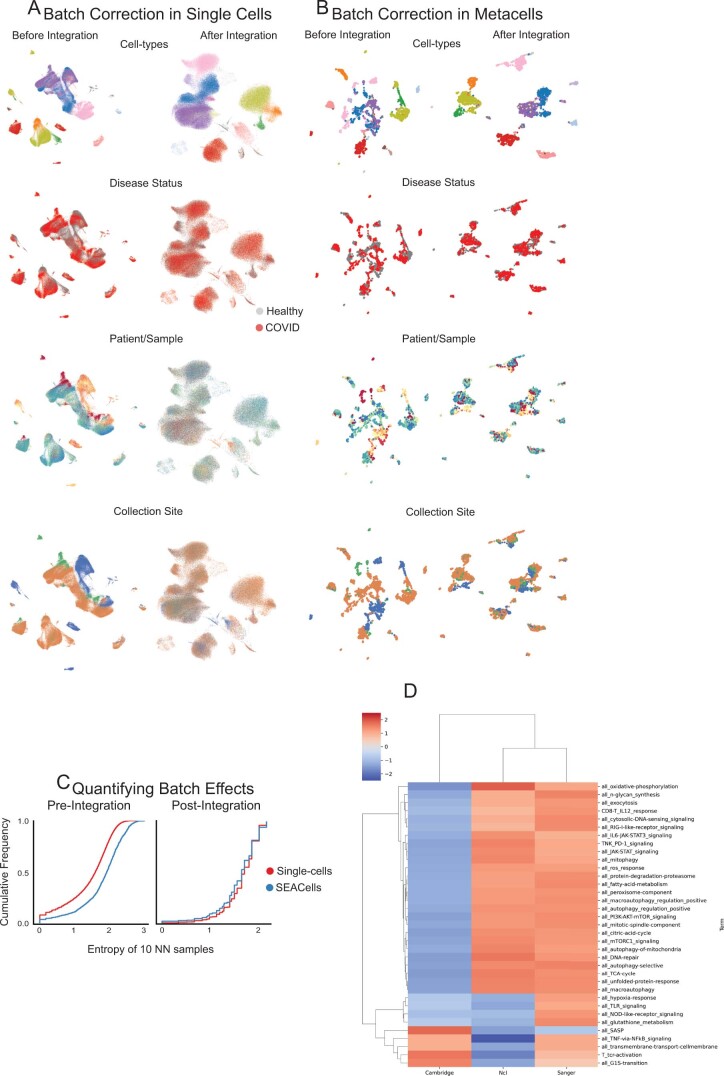
Extended Data Fig. 9. Large-scale data integration using SEACells.
A. UMAPs of single-cell data from healthy donors and critical COVID-19 patients before (left) and after (right) batch correction and data integration using Harmony4. B. Same as (A) for SEACells metacells instead of single cells. C. Cumulative distribution showing the entropy of samples among 10 nearest neighbors before integration (left) and after integration (right). D. GSEA normalized enrichment scores for each T-cell pathway (Supplementary Table 1) for differentially expressed genes among CD4+ T cells from different sites of sample collection.

