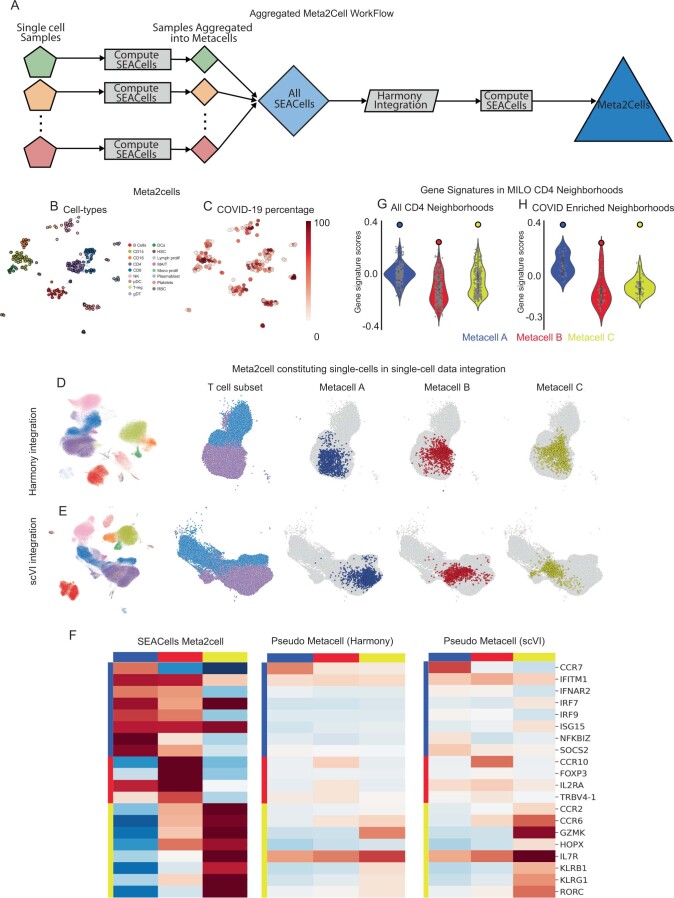
Extended Data Fig. 10. Metacell aggregates enable comparison across conditions.
A. Workflow used to generate metacell aggregates, or meta2cells, that span across healthy and COVID-19 samples. B. UMAPs showing meta2cells, colored by cell type. C. Same as (B), colored by percentage of cells derived from COVID-19 patients. D. Left: Single-cell UMAPs of the healthy and COVID-19 samples following Harmony4 integration. UMAPs on the right illustrate the UMAP region with the T-cell subsets and the cells constituting meta2cells highlighted in Fig. 6D. E. Same as (D), with UMAPs derived using scVI5 latent space. F. Expression patterns of key T-cell defining genes in meta2cells from Fig. 6D, pseudo-metacells derived using Harmony and scVI. Pseudo-metacells were derived using a neighborhood of 1078, 1161, and 1119 cells for metacells A, B and C respectively from the median position of batch-corrected low-dimensional space (see Methods). G, H. Gene signature scores for the CD4+ metacells in Fig. 6D. Violin plots represent signature scores for Milo neighborhoods, solid dots represent scores for the SEACells metacells. Scores are computed for all CD4+ T-cell Milo neighborhoods (G) and for the subset of neighborhoods enriched in COVID-19 (H). Number of metacells = 276. Violin plots display median, 25th(Q1) and 75th (Q3) percentiles; whiskers extend to the furthest datapoint within the range 1.5 *(Q3-Q1); points beyond that are denoted as outliers.

