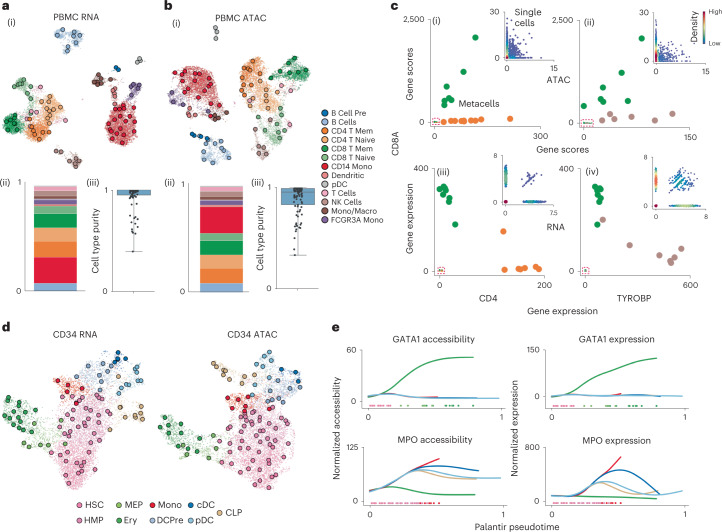
Fig. 2. SEACells metacells accurately identify cell states and outperform alternative approaches.
a, (i) UMAP of human PBMCs in a 10x Genomics multiome dataset17, derived using RNA data, highlighting cell types and SEACells metacells. (ii) Distribution of metacells per cell type for the RNA modality. (iii) Distribution of cell type purity (frequency of the most represented cell type in each metacell). High purity represents a more accurate metacell. Boxes and line represent interquartile range (IQR) and median, respectively; whiskers represent ±1.5× IQR. b, UMAP, metacell and cell type purity distributions of human PBMCs as in a, using ATAC data from the multiome dataset. c, Metacell accessibility (i) and expression (iii) of CD4 and CD8A accurately distinguish CD8 (green) and CD4 (orange) T cell compartments. Metacell accessibility (ii) and expression (iv) of TYROBP and CD8A distinguish NK (brown) and CD8 (green) T cells. Insets: Corresponding single-cell accessibility is too sparse to achieve the same distinction. d, UMAPs of CD34+ HSPCs highlighting cell types and the SEACells metacells independently constructed from RNA (left) and ATAC (right) data. e, Accessibility (left) and expression (right) of GATA1 (erythroid factor) and MPO (myeloid factor) along the Palantir pseudotime axis representing hematopoietic differentiation. Palantir was run on RNA aggregates using ATAC metacells and accurately recapitulates dynamics.

