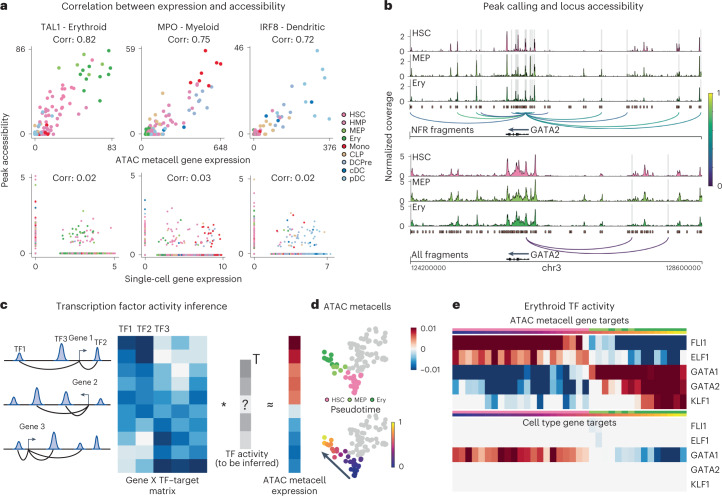
Fig. 3. SEACells empowers a gene regulatory toolkit.
a, Spearman correlation between ATAC metacell-aggregated (top) or single-cell (bottom) gene expression and accessibility of the most correlated peak in TAL1 (erythroid), MPO (myeloid) and IRF (dendritic) marker genes, computed on CD34 multiome data. Each metacell and single cell is colored based on cell type. b, Accessibility landscape of erythroid factor GATA2 in HSCs, MEPs and erythroid cells (Ery) using NFR (top) or all ATAC (bottom) fragments. Restricting chromatin accessibility analysis to NFR fragments improves peak resolution and the association of regulatory elements with genes. Arcs are colored by peak–gene Spearman correlation (color values between 0 and 1 at right), determined using SEACells ATAC metacells. Highlighted peaks correlate significantly with GATA2 expression (two-sided nominal P < 0.1, empirical null distribution). c, Left: To construct a TF–target matrix for TF activity inference, motif scores of motifs within peaks are weighted by peak–gene correlations, as identified using SEACells metacells, for each gene. Right: The SEACells-derived TF–target matrix is used to predict the expression profile of a metacell and to infer TF activities per metacell. d, UMAPs highlighting metacells of the erythroid lineage, colored by pseudotime. e, Top: activities of top TFs across metacells of the erythroid lineage using the SEACells-derived TF–target matrix as input. Bottom: activities of the same TFs derived using the cell-type-specific TF–target matrix derived from pseudobulk ATAC profiles.

