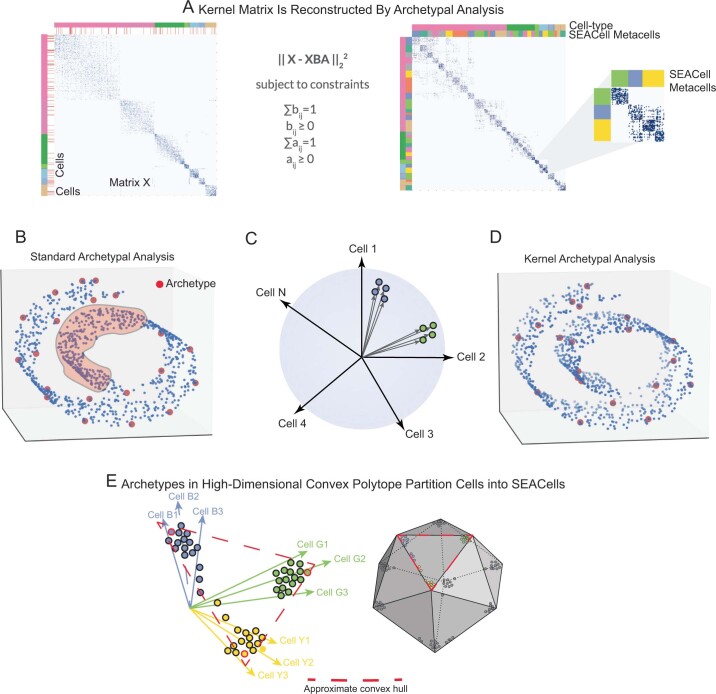
Extended Data Fig. 1. Kernel archetypal analysis to identify metacells.
A. The kernel matrix (left) is decomposed into two the archetype matrix B and embedding matrix A. Metacell membership is identified based on column-wise maximal values across the matrix A. Right: The kernel matrix but ordered by metacell assignment. B. Standard archetypal analysis which uses linear convex hull approximation leads to identification of archetypes at the boundaries with no archetypes in internal regions of the manifold (highlighted region). C. The use of cell-cell similarity kernels to describe single-cell data casts highly similar cells into tiny clusters along a cone emanating from the origin. D. Kernel archetypal analysis opens up the interior regions and thus archetypes are identified across the manifold. E. The greater number of archetypes that result from kernel archetypal analysis, in addition to the use of a Gaussian kernel, creates a large number of highly similar cell ‘pockets’, each representing a unique biological state.

