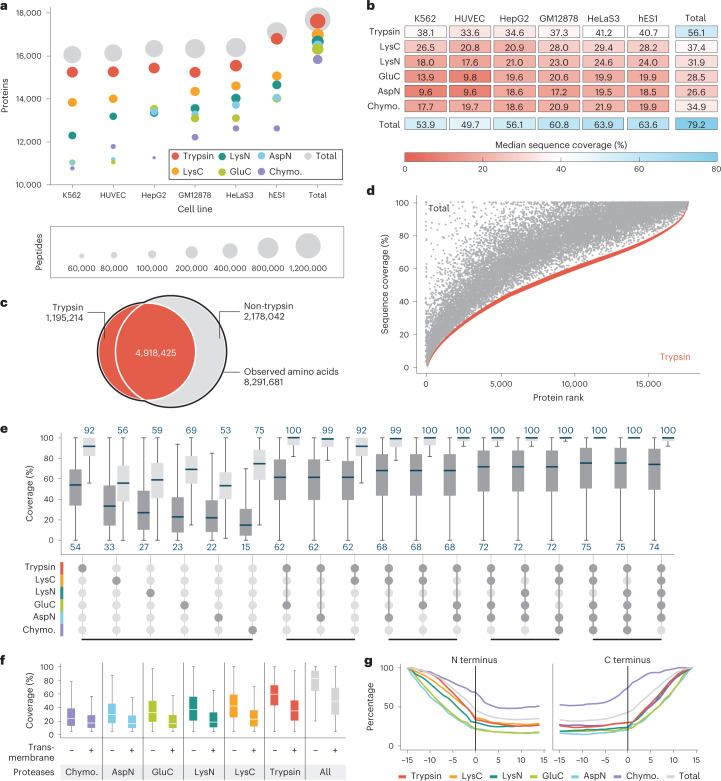
Fig. 2. Overview of results from deep proteomics analysis.
a, Number of proteins detected for each of the six cell lines and cumulative as a function of peptides from the various protease digests. b, Median sequence coverage of various cell line proteomes achieved by digests with individual proteases and by combining all protease results. Supplementary Fig. 2c shows sequence coverage distributions separately for all combinations of cell lines, proteases and fragmentation methods. c, Venn diagram of all observed amino acids digested by trypsin versus all proteases combined excluding trypsin. d, Sequence coverage for each of the detected proteins for the tryptic peptide data (red) and combined protease digests, including trypsin (gray). e, Observed (dark gray) and theoretical (light gray) distributions of sequence coverage achieved for various combinations of proteases. The top three combinations of 2, 3, 4 or 5 proteases are displayed. f, Protein coverage comparison of transmembrane and nonmembrane proteins. For e and f, the lower whisker/quartile and upper quartile/whisker show the 5th, 25th, 75th and 95th percentiles, accordingly. g, Relative protein coverage of N terminus (left) and C terminus (right) transmembrane segments. Chymo., chymotrypsin.

