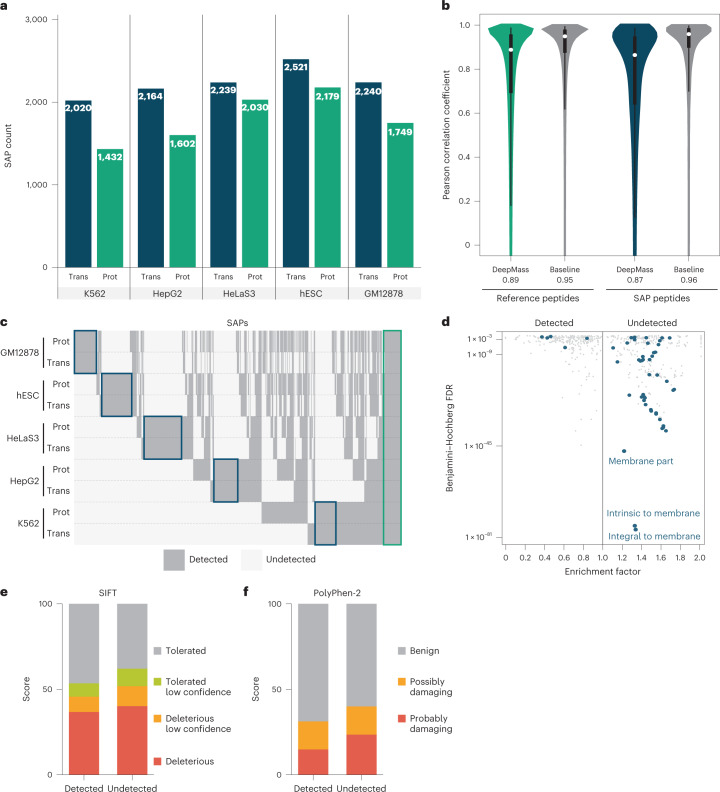
Fig. 3. Discovery of proteins with SAPs.
a, Comparison of SAPs discovered in the ENCODE transcriptomic data (Trans) and presented proteomics data (Prot) for each of the cell lines. b, Distribution of correlation coefficients between observed and predicted by DeepMass60 spectra. The baseline distribution shows acquisition-to-acquisition variation by comparing observed spectra for peptides. The white circle shows the median value. The lower and upper quartiles of the box demonstrate the 25th and 75th percentiles, accordingly. The lower and upper whiskers show the 5th and 95th percentiles, accordingly. The distributions are based on 5,128,969, 442,476, 16,516 and 4,969 comparisons (from left to right). c, Clustered binary heatmap of the detected SAPs row-grouped by cell line and omics platform (transcriptomics or proteomics). Blue rectangles highlight clusters specific to each cell line, and the green rectangle SAPs that are conserved across all cell lines. d, Gene ontology (GO) enrichment of genes with SAPs detected or undetected by MS. Genes with a mixed population of SAPs were removed, and repeats collapsed. Blue dots highlight GO terms with the word ‘membrane’ mentioned in the name. e. SIFT-generated61 score distribution over four categories for detected and undetected SAPs. Applying the two-sided Wilcoxon rank sum test on the raw scores results in P value of 2 × 10⁻⁸. f, The same as e, but for the PolyPhen-2 (ref. 62) tool. Applying the two-sided Wilcoxon rank sum test on the raw scores results in P value of 1.1 × 10⁻¹².

