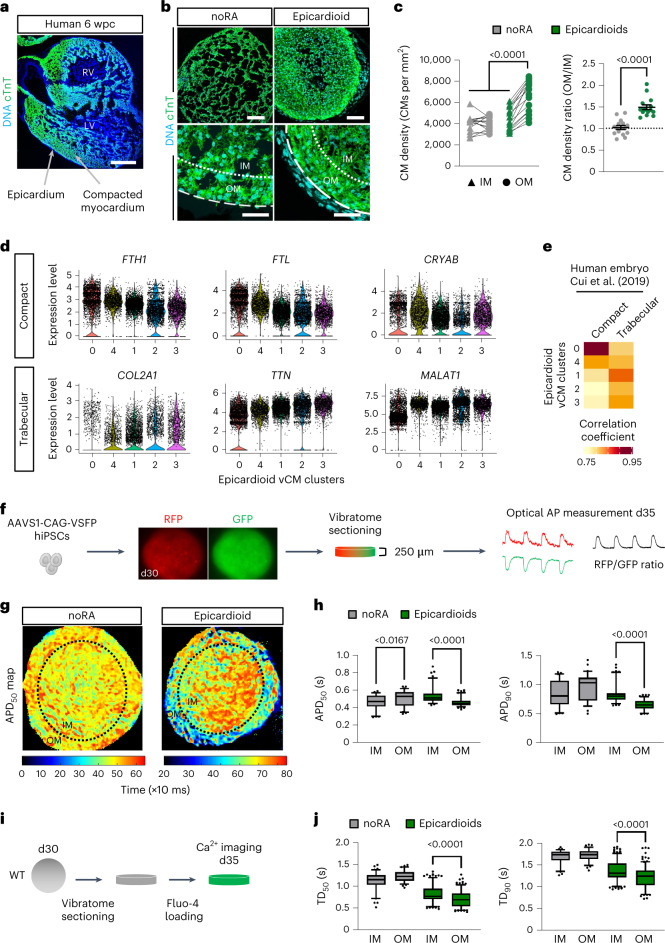
Fig. 2. Epicardioids display morphological, molecular and functional self-patterning of the myocardium.
a,b, Immunostaining for cTnT in human ventricular tissue (6 weeks postconception (wpc); a) and in noRA spheroids and epicardioids (day 15; b). Images are representative of three independent samples and six differentiations, respectively; RV, right ventricle; LV, left ventricle. In b, dashed lines indicate the outer edge of the myocardium, and dotted lines indicate separation between the OM (50 µm wide) and IM; scale bars in a, 500 µm; scale bars in b, 100 µm (top) and 50 µm (bottom). c, Left, CM density in the OM and IM of noRA spheroids and epicardioids (day 15). For all data points, lines connect values from the same sample; n = 15 spheroids and 3 independent differentiations per group. Data were analyzed by two-way ANOVA with a Tukey’s multiple comparisons test. Right, ratio of CM density OM to IM. Data are shown as mean ± s.e.m.; n = 15 spheroids and 3 independent differentiations per group. Data were analyzed by unpaired two-tailed t-test. d, Expression levels of compact and trabecular markers in scRNA-seq vCM clusters from epicardioids (days 15 and 30). e, Correlation analysis between vCM clusters and compact or trabecular CMs from human embryos18 (coefficients are in pseudocolor). f, Three-dimensional differentiation of hiPSCs expressing a FRET-based voltage indicator (AAVS1-CAG-VSFP) for optical action potential (AP) measurement in 250-µm-thick slices at day 35. g, Representative map of APD50 in a noRA spheroid and epicardioid (day 35). h, APD50 (left) and APD90 (right) in the OM and IM of noRA spheroids and epicardioids under 0.5-Hz pacing (day 35); n = 60 action potentials per layer and 3 noRA spheroids; n = 100 action potentials per layer and 6 epicardioids. Three independent differentiations per group were performed. Data were analyzed by Kruskal–Wallis test with a Dunn’s multiple comparisons test. i, Calcium transient imaging in 250-µm-thick slices cut at day 30 and loaded with Fluo-4 at day 35. j, Transient duration at 50% (TD50; left) and transient duration at 90% (TD90; right) in the OM and IM of noRA spheroids and epicardioids under 0.5-Hz pacing (day 35); n = 75 transients per layer and 4 noRA spheroids; n = 200 transients per layer and 9 epicardioids. Three independent differentiations per group were performed. Data were analyzed by Kruskal–Wallis test with a Dunn’s multiple comparisons test. Box plots in h and j indicate the median and 25th and 75th percentiles, with whiskers extending to the 5th and 95th percentiles.

