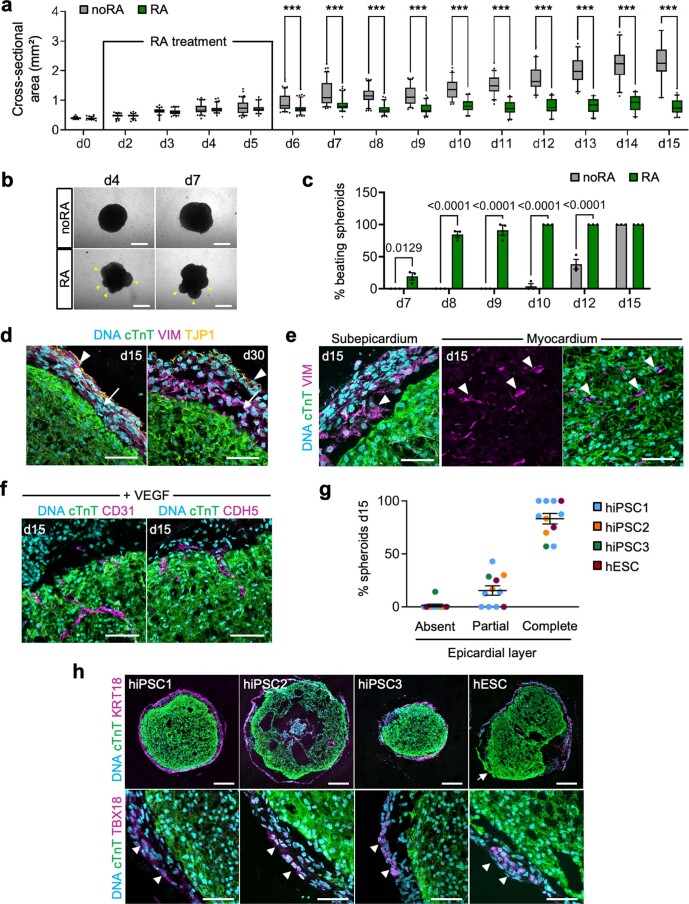
Extended Data Fig. 1. Characterization of 3D cardiac induction with or without retinoic acid.
(a) Cross-sectional area of spheroids during 3D cardiac induction with retinoic acid (RA) or without (noRA). Box plots indicate the median, 25th and 75th percentile, with whiskers extending to the 5th and 95th percentiles. N per day provided in the Source Data; 3 independent differentiations/group; two-way ANOVA with Sidak’s multiple comparisons test, ***p < 0.0001. (b) Representative bright field images of spheroids at days 4 and 7 of differentiation. Yellow arrowheads indicate rounded protrusions typical of RA spheroids. Scale bars = 500 µm. (c) Percentage of beating spheroids at the indicated days of differentiation; mean ± SEM. noRA: N = 55 spheroids, RA: N = 96 spheroids; 3 independent differentiations/group. Two-way ANOVA with Sidak’s multiple comparisons test. (d) Immunostaining for cTnT, TJP1 and VIM in epicardioids (days 15 and 30). Arrowheads = mesothelial epicardium; arrows = epicardium-derived cells. Scale bars = 50 µm. (e) Immunostaining for cTnT and VIM in epicardioids (day 15). Arrowheads indicate examples of cTnT− VIM+ mesenchymal cells in the subepicardial space (left) and within the myocardium (right). Scale bars = 50 µm. (f) Immunostaining for cTnT and CD31 or CDH5 in VEGF-treated epicardioids (day 15). Scale bars = 50 µm. Images in (d-f) are representative of 3 independent differentiations. (g,h) Percentage of spheroids with an absent, partial or complete epicardial layer at day 15 of epicardioid differentiation of different human induced pluripotent (hiPSC) or embryonic stem cell (hESC) lines. The starting cell number was adapted to the cell lines’ proliferation rate to obtain a consistent spheroid size at day 0. Mean ± SEM; hiPSC1: N = 6 independent differentiations, hiPSC2: N = 2, hiPSC3: N = 1, hESC: N = 2; N per differentiation provided in the Source Data. (g) Representative images of cTnT and cytokeratin 18 (KRT18) (top) or TBX18 (bottom) immunostaining of day-15 epicardioids from the different hPSC lines. The arrow indicates an example of a partial epicardial layer, arrowheads show examples of TBX18+ epicardial cells. Scale bars top = 200 µm, bottom = 50 µm. (h).

