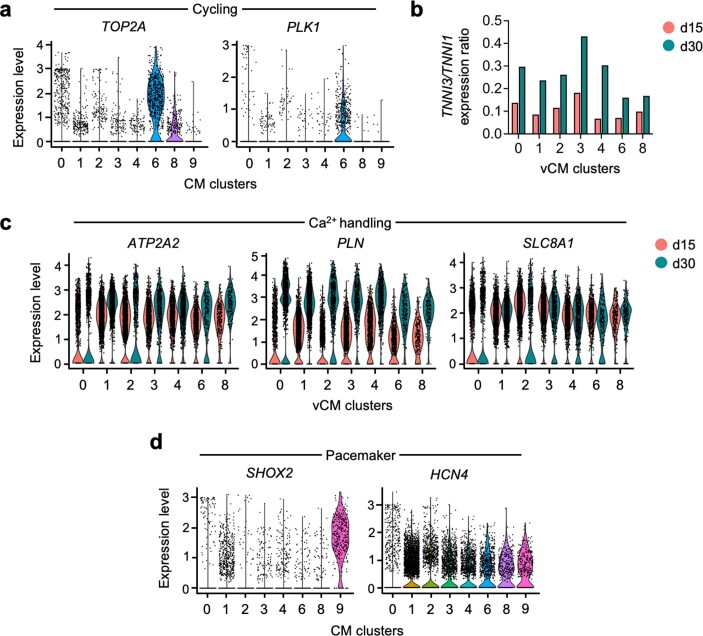
Extended Data Fig. 2. Transcriptional profiles of myocytic clusters in epicardioids at days 15 and 30.
(a) Violin plots of the expression levels of markers of cycling cells (TOP2A, PLK1) in the cardiomyocyte (CM) clusters obtained from the scRNA-seq analysis of epicardioids at days 15 and 30. (b) Average expression ratio of the adult to fetal cardiac troponin I isoforms (TNNI3/TNNI1) in ventricular CM (vCM) clusters obtained from scRNA-seq analysis of epicardioids at days 15 and 30. (c) Violin plots of the expression levels of genes related to CM Ca2+ handling (ATP2A2, PLN, SLC8A1) in vCM clusters; cells from epicardioids at day 15 and 30 are shown in red and blue, respectively. (d) Violin plots of the expression levels of markers of pacemaker CMs (SHOX2, HCN4) in the CM clusters obtained from the scRNA-seq analysis of epicardioids at days 15 and 30.

