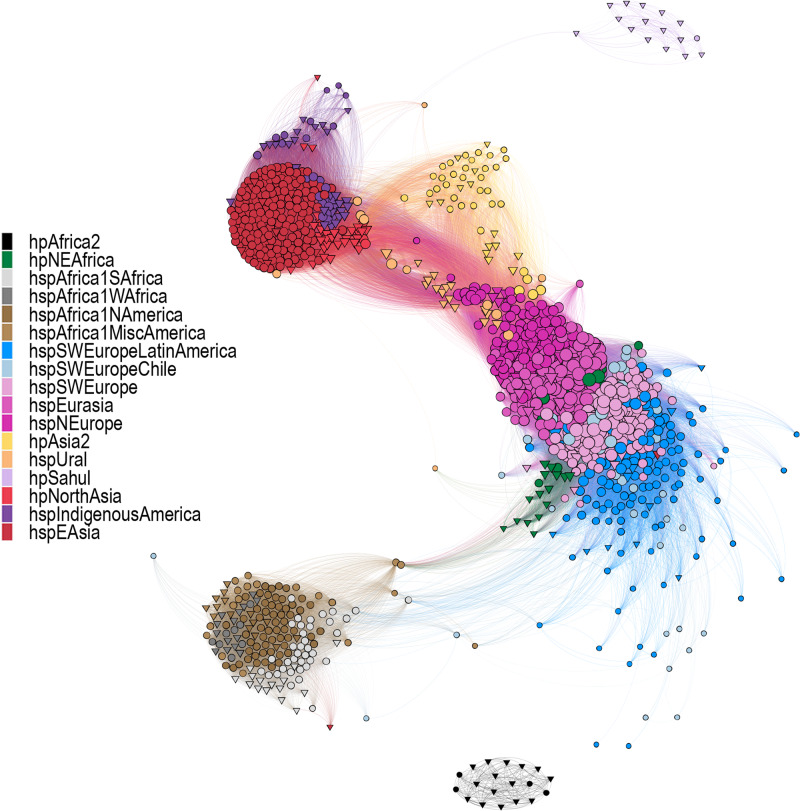
Fig. 2. Distance network analyses of the core genome of the H. pylori strains studied.
Fruchterman–Reingold layout of the pruned distance network between HpGP genomes (circles) and reference genomes (triangles) (see Methods). Colors indicate the H. pylori population (hp) and subpopulation (hsp) as assigned by fineSTRUCTURE (Supplementary Figs. 1 and 2). The length and opacity of each link are proportional to the genetic distance between genomes (nodes), with higher opacity and shorter length indicating genetic closeness and less opacity and higher length indicating higher genetic distance between strains. The size of each node is proportional to the connectivity (number of links) of that node, indicating that bigger nodes have connections to more other strains than those of lesser sizes.

