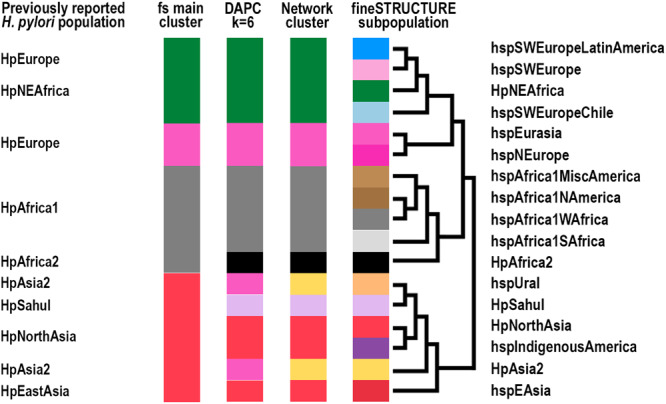
Fig. 5. Summary of population classifications.

Summary of the clustering results using the respective analyses in relation to previously reported MLST and whole genome-based H. pylori populations (Hp) and subpopulations (hsp). Colors are based on classifications from the fineSTRUCTURE (fs) analyses visualized in Supplementary Fig. 1, on the K = 6 discriminant analysis of principal components, DAPC (Supplementary Fig. 3), and the network clusters (Fig. 2). The topology of the dendrogram to the left is based on the fineSTRUCTURE hierarchical clustering of Supplementary Fig. 1.
