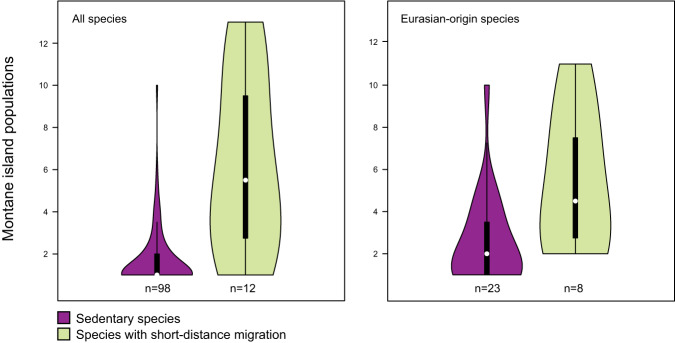
Fig. 5. Number of montane island populations (MIPs) per species, for species with or without short-distance migrant populations.
The violin plots show full data distributions superimposed over standard boxplots. Each box indicates the interquartile range (IQR), with bottom and top edges representing the first (Q1) and third quartiles (Q3), respectively. The median (Q2) is indicated with a white circle. Whiskers extend to minima and maxima not exceeding 1.5 times the IQR below Q1 or above Q3. Short-distance migrant populations occur only outside the focal archipelagos, and no species with MIPs have long-distance migrant populations. At left: all 110 species with MIPs in the focal region, including species we did not genetically sample. At right: Eurasian-origin species only. The numbers of species included in each sample are given below the respective plots. Source data for the figure can be found in Supplementary Data 1.

