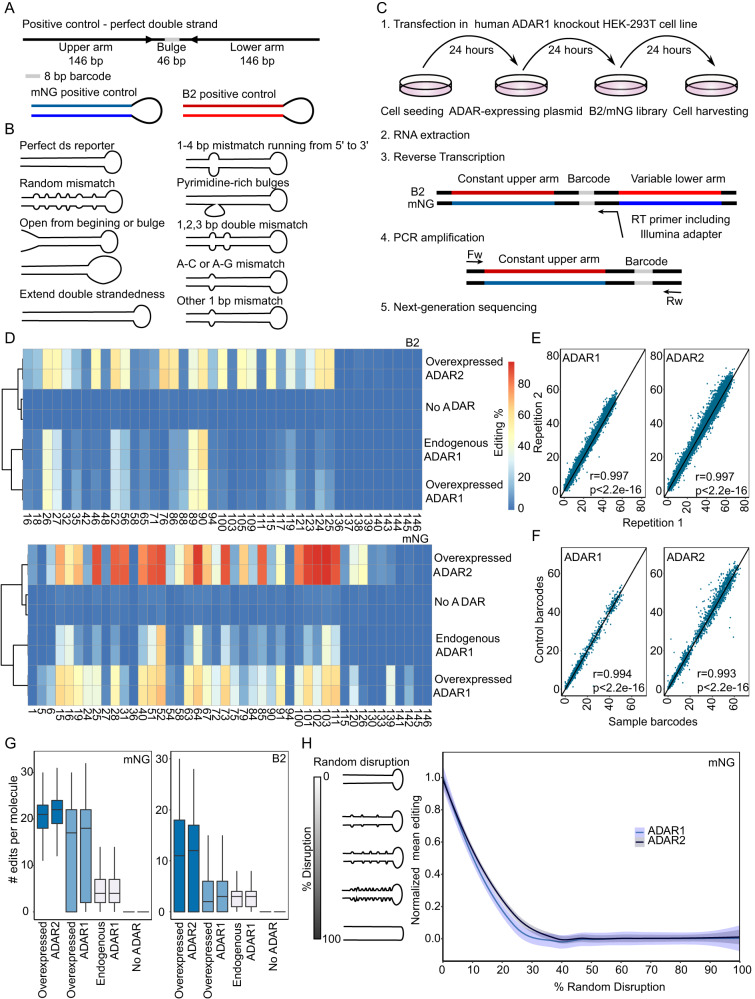
Fig. 1. Systematic screening of ADAR2 synthetic substrates in ADAR1 knockout HEK293T cell lines.
A Design of double-stranded reporters. B2 and mNG are based on a mouse non-coding B2 element and the mNeonGreen gene, respectively. B Repertoire of sequence series in B2 and mNG libraries. C Experimental pipeline: Expression of the synthetic libraries in ADAR1-knockout HEK293T cells, which exogenously overexpress ADAR1 or ADAR2, and library preparation. RNA was extracted, and the constant arm and barcode of each construct were reverse transcribed. Subsequently, PCR amplification and sequencing using Novaseq 6000 platform with a 300 bp kit were performed. D A-to-I editing levels in the B2 (upper diagram) and mNG (lower diagram) perfect double-stranded constructs in No-ADAR, ADAR1-overexpressing or ADAR2-overexpressing ADAR1-KO HEK293T cells, and wild-type HEK293T cells. E Correlation of A-to-I levels among technical duplicates in cells overexpressing either ADAR1 or ADAR2. Each dot depicts the editing percentage of each adenosine in each construct of the B2 oligo library. The Pearson correlation coefficient is displayed, along with the associated statistical significance based on a two-sided test F Correlation of editing levels in B2 constructs that differ in the barcode sequences. Two-sided tests were based on Pearson’s correlation coefficient, which follows a t-distribution with degrees of freedom ‘number of observations −2’ assuming normal distributions G Boxplots representing the distribution of numbers of editing events in the single mNG/B2 perfect double-stranded molecules in either No-ADAR cells, ADAR-overexpressing cells, or wild-type HEK293T cells. Data is visualized via box-and-whisker plots, with the central line denoting the median, box edges representing the interquartile range (from the 25th to the 75th percentile), and whiskers indicating the 1.5 times interquartile range. H Min-Max normalized mean editing percentage within a subset of mNG constructs featuring incremental 5% disruptions of double-strandedness. Data from both replicates are combined, and a LOESS fit (in blue) is applied to the Min-Max normalized mean editing percentage. The gray band surrounding the regression line represents the 95% confidence interval.

