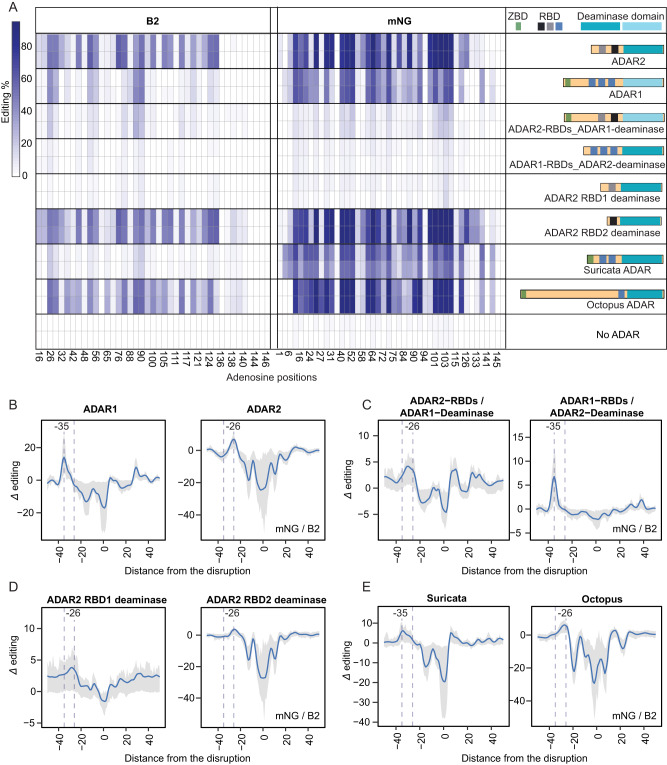
Fig. 3. Editing is induced at ADAR-dependent fixed intervals upstream from structural disruptions.
A Heatmap of A-to-I editing levels in the perfect double-stranded constructs in No-ADAR and ADAR-overexpressing ADAR1-KO HEK293T cells. The adenosine positions of the B2 and mNG perfect double-stranded constructs are depicted at the bottom of the heatmap. The illustrations of each ADAR including the RBDs and deaminase domain are depicted on the right side. ZBD: Z-binding domain; RBD: RNA binding domain. B ADAR1- and ADAR2-mediated editing offset based on subsets of 3-nucleotide mismatch running throughout the mNG and B2 sequences. Data is shown as the LOESS fit curve (blue-colored) of Δ editing with a span of 0.05, and the gray-shaded region spans the 25th percentile and 75th percentile values of Δ editing per distance. C Editing offset based on subsets of 3-nucleotide mismatch running throughout the mNG and B2 sequences in ‘ADAR2-RBDs_ADAR1-deaminase’- and ‘ADAR1-RBDs_ADAR2-deaminase’-overexpressing cells. Data is shown as Fig. 3B. D Editing offset retrieved from subsets of 3-nucleotide mismatch running throughout the mNG and B2 sequences in ‘ADAR2-RBD1 deaminase’- and ‘ADAR2-RBD2 deaminase’-overexpressing cells. Data is shown as Fig. 3B. E Editing offset based on subsets of 3-nucleotide mismatch running throughout the mNG and B2 sequences in ‘Suricata ADAR’- and ‘Octopus ADAR’- overexpressing cells. Data is shown as Fig. 3B.

