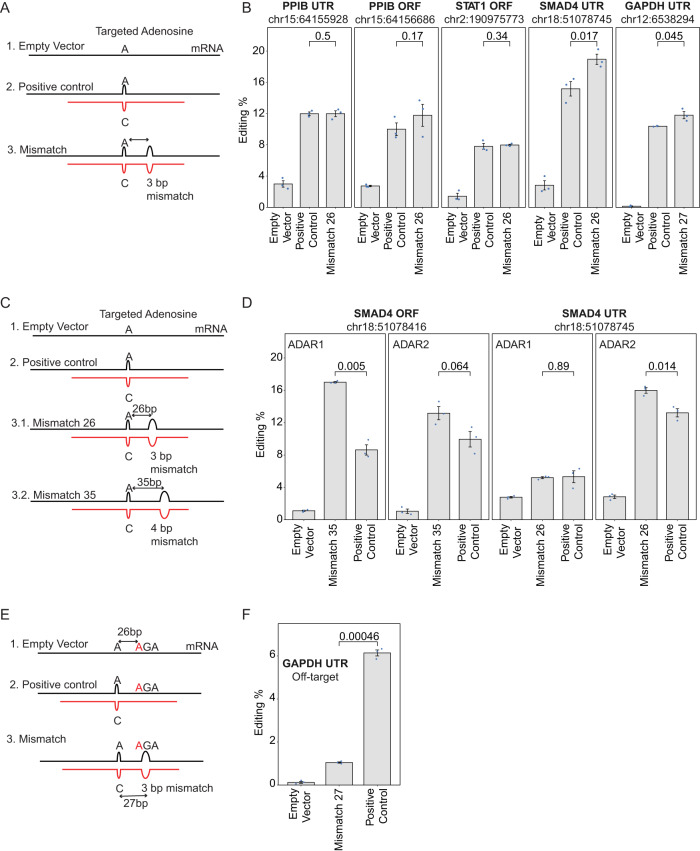
Fig. 4. Targeted editing of endogenous transcripts using engineered ADAR2- and ADAR1-recruiting RNAs.
A Scheme of arRNAs targeting endogenous transcripts of PPIB, SMAD4, STAT1, and GAPDH. (1) The empty vector has no targeting oligo. (2) Positive control construct is a 151-bp-long complementary oligo, with a T to C mismatch opposite of the targeted A. (3) Mismatch 26 construct consists of an arRNA as in (2) but including a 3-bp mismatch at 26 or 27 bases away from the target A site. B Quantification results showing the editing levels on targeted adenosine of the PPIB, SMAD4, STAT1, and GAPDH transcripts in ADAR2-expressing cells. Data is shown as the mean ± s.e.m.(standard error of the mean) with n = 3 independent experiments. The pairwise comparisons were evaluated using a one-tailed t-test and the corresponding p-values are shown on the top of the barplots. C Scheme of arRNAs targeting endogenous transcripts of SMAD4. (1) The empty vector has no targeting oligo. (2) Positive control construct is a 151-bp-long complementary oligo, with a T to C mismatch opposite of the targeted A. (3.1) Mismatch 26 construct consists of an arRNA as in (2) but including a 3-bp mismatch at 26 bases away from the target A site. (3.2) Mismatch 35 construct consists of an arRNA as in (2) but including a 4-bp mismatch at 35 bases away from the target A site. D Quantification results showing the editing levels on targeted adenosine of the SMAD4 transcript in ADAR1- and ADAR2-expressing cells. Data is shown as the mean ± s.e.m.(standard error of the mean) with n = 3 independent experiments. The pairwise comparisons were evaluated using a two-tailed t-test and the corresponding p-values are shown on the top of the barplot. E Scheme of arRNAs targeting endogenous GAPDH transcript. F Quantification results showing the editing levels on off-targeted adenosine of the GAPDH transcript in ADAR2-expressing cells. Data is shown as the mean ± s.e.m. (standard error of the mean) with n = 3 independent experiments. The pairwise comparisons were evaluated using a two-tailed t-test and the corresponding p-values are shown on the top of the barplot.

