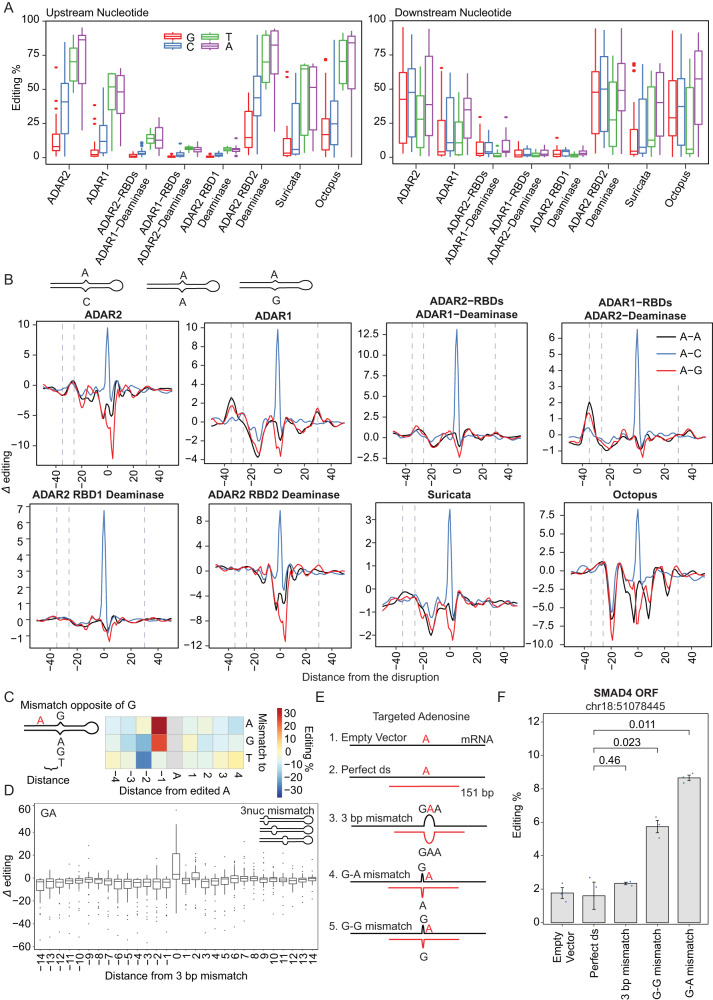
Fig. 5. Sequence and structure elements involved in editing nucleation and termination among ADARs.
A Upstream (left) and downstream (right) nucleotide preference in ADAR-specific editing. Editing levels correspond to adenosines along both double-stranded constructs, but As near the loop were excluded. Data is visualized using box-and-whisker plots, where the central line represents the median, the box edges depict the interquartile range, and the whiskers show 1.5 times the interquartile range. B Constructs characterized by a systematic C, A or G base opposite to A along the stem. Line charts show the effect of the different mismatches on editing. The Δ editing level on the y-axis represents the change in the editing level of an adenosine, normalized to the double-stranded construct. Fitted curves depict the LOESS fit of Δ editing with a span of 0.07. C Subset of G-mismatching bases that neighbor the edited sites. Left—Graphical scheme. Right—On the heatmap, the x-axis shows the distance of the disruptions to the A site while the y-axis represents the base to which a G is opposite. D Effect of 3-nt mismatch running through the stem on adenosine within the GA sequence context in ADAR2-expressing cells. Mismatches differentially located in each construct get centered at 0 on the x-axis. The Δ editing on the y-axis represents the change of the editing of an adenosine, normalized to the perfect double-stranded construct. The box plot depicts the distribution of Δ editing levels per distance. Data is shown as Fig. 5A. E Scheme of arRNAs targeting endogenous SMAD4 transcript. (1) The ‘Empty Vector’ as negative control. (2) ‘Perfect ds’ construct is a 151-bp oligo complementary to the transcript. (3) ‘3 bp mismatch’ construct consists of an arRNA as in (2) but containing a 3-nucleotide mismatch opposite to the target A site. (4-5) ‘G-G and G-A mismatch’ constructs consist of an arRNA as in (2) but including a G-G and G-A mismatches one nucleotide upstream from the A site. F Quantification showing the editing levels on the adenosine of the SMAD4 in ADAR2-expressing cells, presented as mean ± s.e.m. (n = 3 independent experiments) and evaluated with a two-tailed t-test.

