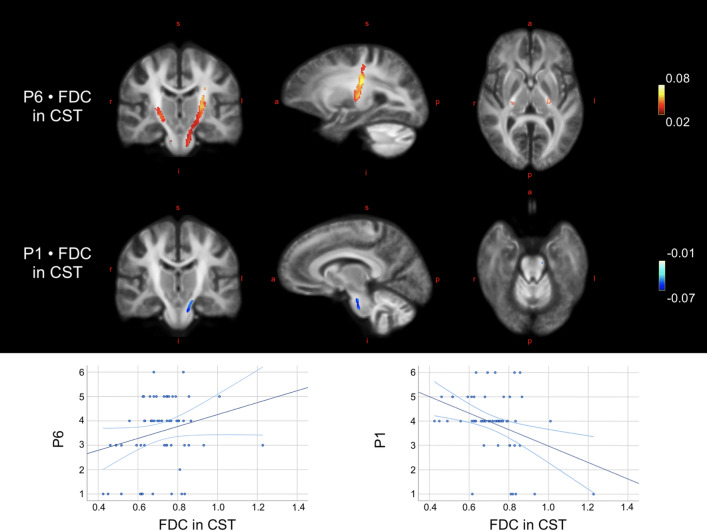
Fig. 3.
Correlations between fixel-wise measures and psychosis-specific symptoms. Top image illustrates the localization of the significant correlations between fixel-wise measures and the PANSS items P1 and P6 in corticospinal tract (CST) in the substance-free sample. Blue colours indicate negative correlations, red/yellow colours indicate positive correlations. Colour is graded according to beta estimate as proxy to effect size. Images are displayed in radiological directions. Bottom row: scatterplots illustrate the associations between FDC of the significant fixels of CST and the items scores of P1 and P6, respectively. a anterior, FDC fibre density and cross-section, i inferior, l left, p posterior, r right, s superior

