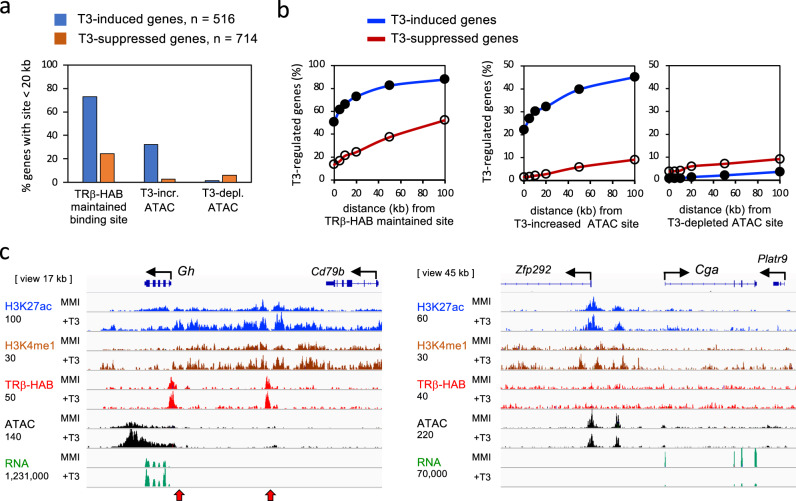
Fig. 6. T3-regulated chromatin and pituitary gene expression.
a Column graphs of the association of T3-dependent pituitary gene expression with TRβ-HAB bound sites (maintained category), T3-increased ATAC sites, and T3-depleted ATAC sites within 20 kb of the gene body. Analysis of 8384 maintained TRβ-HAB sites; 1424 T3-increased ATAC sites and 352 T3-depleted ATAC sites (Fig. 4c). b Curve plots of the association of T3-dependent pituitary gene expression with TRβ-bound sites, T3-increased and T3-depleted ATAC sites at distances up to 100 kb from the gene. c Example of the T3-induced Gh gene showing TRβ-bound sites (red arrowheads), T3-regulated open chromatin (ATAC) and histone marks. In contrast, the strongly T3-suppressed Cga gene lacks obvious regulation of chromatin by T3 or detectable TRβ binding. Raw reads scale on left, below each mark label.

