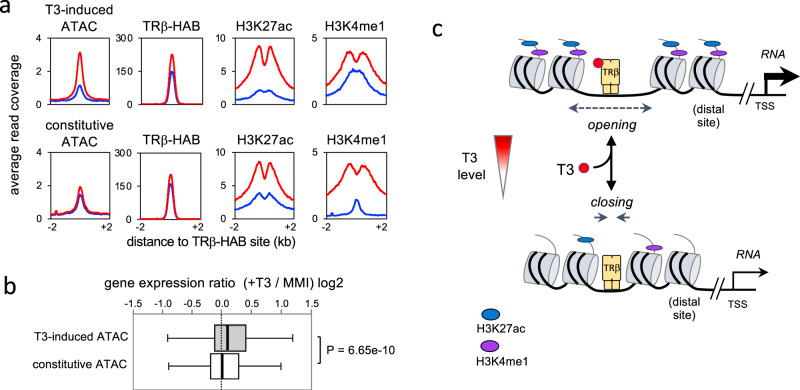
Fig. 7. Inducible open chromatin at T3-sensitive sites.
a Comparison of T3-inducible versus constitutively open chromatin (ATAC peaks) at T3-sensitive, putative enhancer sites in the pituitary gland. Analysis of 1,008 inducible ATAC sites versus the top 1008 constitutive ATAC peaks (of 5809 non-regulated ATAC peaks). Both groups maintain TRβ binding regardless of T3 status and have DR4 as the top motif. b Box plot of distribution of T3-regulated genes (RNA level) for both groups of ATAC sites. The median (line in 50% range box) differs significantly. Genome-wide analysis of all genes within 100 kb of ATAC sites (2,030 genes for T3-increased ATAC peaks; 2808 genes for constitutive ATAC peaks). Statistical analysis by Mann–Whitney test. c Simplified model for a T3-activated pituitary enhancer. Receptor-bound enhancers, typically at distal sites, dynamically and reversibly control chromatin opening and histone modifications according to the T3 level.

