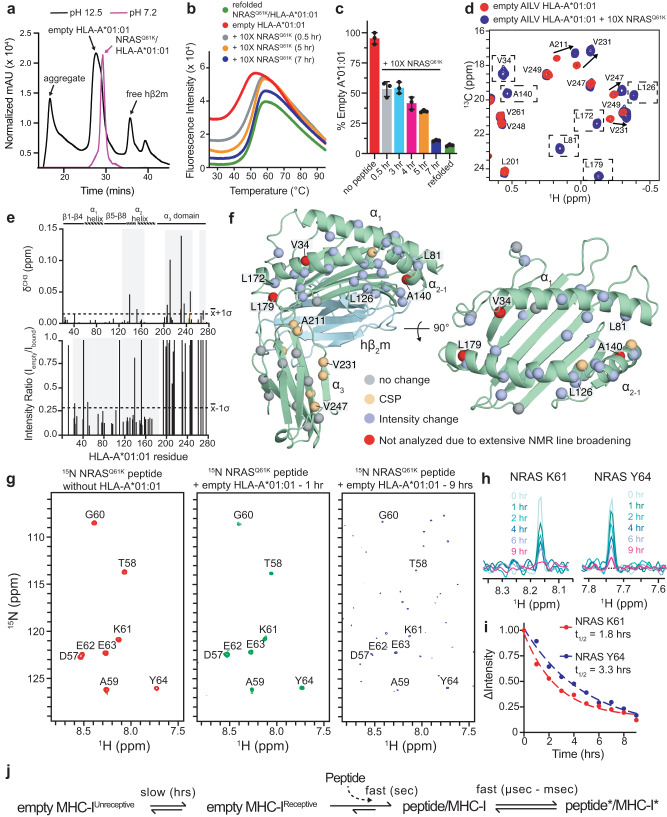
Fig. 1. Conformational changes and assembly kinetics for NRASQ61K association with empty HLA-A*01:01/hβ2m.
a SEC traces of HLA-A*01:01/hβ2m following short exposure to neutral (magenta) or basic (black) phosphate buffer. b DSF of 7 μM HLA-A*01:01/hβ2m following short exposure to pH 12.5 phosphate buffer. Red curve – no peptide added. 10× excess NRASQ61K peptide was added and incubated for 0.5 (gray), 5 (orange), and 7 (blue) hrs. Green curve – refolded NRASQ61K/HLA-A*01:01/hβ2m control. c Percent empty HLA-A*01:01 determined by DSF upon incubating empty HLA-A*01:01 without or with 10× excess NRASQ61K peptide for the indicated amount of time. Refolded complex is shown for reference. Data are mean ± SD for n = 3 technical replicates. d 2D 1H-13C methyl HMQC spectra of 50 μM AILV labeled HLA-A*01:01 refolded with natural abundance hβ2m following exposure to pH 12.5 phosphate buffer (red – no peptide; blue – 10× excess NRASQ61K peptide added) recorded at 25 °C at a 1H field of 800 MHz. Dotted boxes represent methyl resonances exhibiting line broadening in the empty state. e Chemical shift perturbations (CSP, δCH3, ppm) (top) and intensity ratios (Iempty/Ibound) (bottom) for AILV methyl probes of HLA-A*01:01 with 10× excess NRASQ61K (Ibound) relative empty HLA-A*01:01 (Iempty). Dotted lines represent the average plus one standard deviation for CSP analysis or minus one standard deviation for intensity ratio analysis. Gray boxes highlighted affected regions. The protein domains of HLA-A*01:01 are shown for reference. f Mapping of HLA-A*01:01 methyl residues with resonances exhibiting either CSP or intensity changes upon binding to NRASQ61K onto the X-ray structure of HLA-A*01:01 (PDB ID 6AT9, peptide atoms removed). g 2D 1H-15N HMQC spectra of 15N labeled NRASQ61K without (red) or with empty unlabeled HLA-A*01:01/hβ2m after 1 h (green) or 9 h (blue) of incubation recorded at a 1H field of 800 MHz at 25 °C. h 1D 1H spectral slices for the amide of K61 and Y64 of 15N labeled NRASQ61K throughout incubation in panel (g). i The change in NMR signal intensity (ΔIntensity) as a function of incubation time and fitted half-life (t1/2) values for K61 and Y64. j Schematic of the timescale for different conformational changes in the MHC-I complex.

