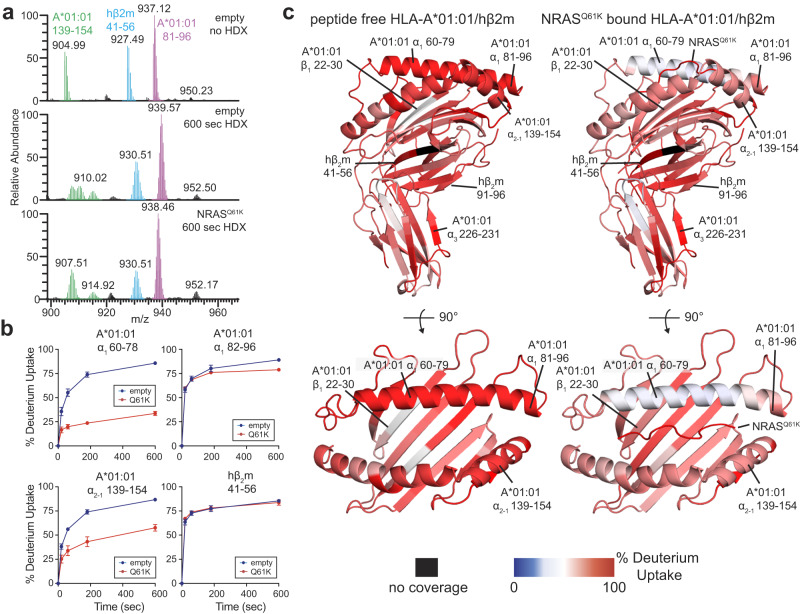
Fig. 4. Global conformational plasticity of empty vs NRASQ61K bound HLA-A*01:01/hβ2m visualized by hydrogen/deuterium exchange.
a Mass spectrometric envelopes for peptide fragments comprising residues HLA-A*01:01 81–96 (magenta), HLA-A*01:01 139–154 (green), and hβ2m 41–56 (blue) for emptied HLA-A*01:01 with no HDX (i.e., all H sample) and 600 s HDX compared with NRASQ61K bound HLA-A*01:01 at 600 s HDX. The peptide fragment masses are noted. b Kinetic graphs of % deuterium uptake (back-exchange corrected) for different peptide fragments as a function of HDX time (0, 20, 60, 180, or 600 s) shown for emptied (blue) versus NRASQ61K bound (red) HLA-A*01:01/hβ2m. Data are mean % deuterium uptake ± SD from triplicate experiments. c Structure view of average % deuterium uptake at 600 s (back-exchange corrected) for empty and NRASQ61K bound HLA-A*01:01/hβ2m plotted onto PDB IDB 6MPP without or with atoms corresponding to NRASQ61K. Color ranges from deep blue (no deuterium uptake) to red (100% deuterium uptake). Black indicates regions where peptides were not obtained. Mean % deuterium uptakes at 600 s (back-exchange corrected) were resolved to individual peptide fragments and obtained from three independent samples.

