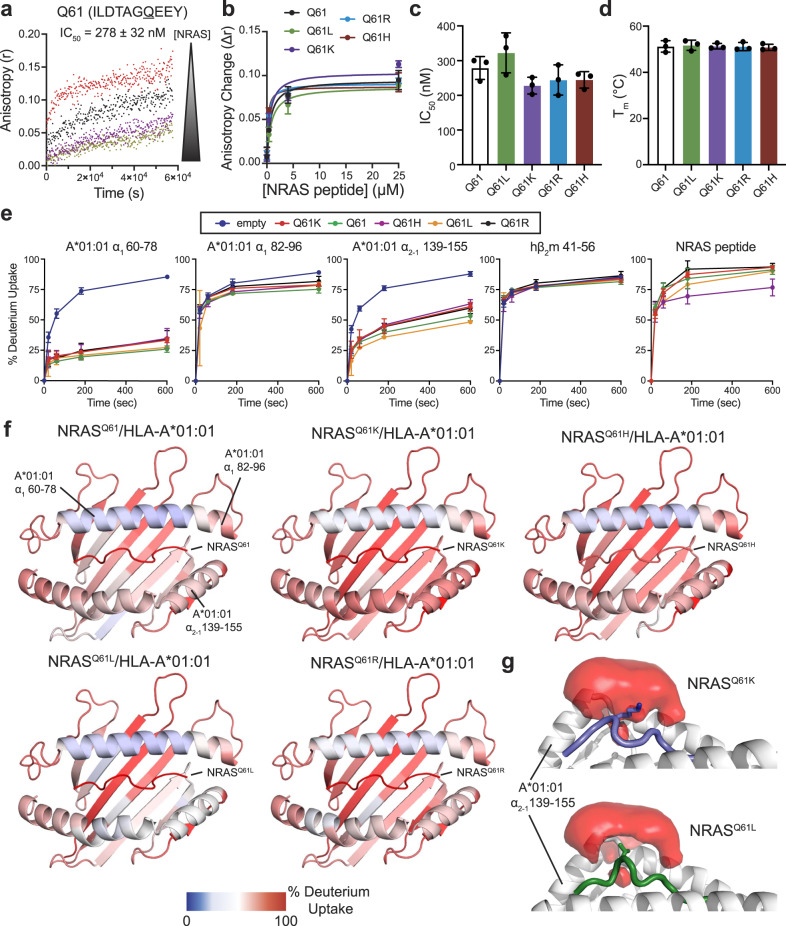
Fig. 5. Affinity, stability, and conformational plasticity of cancer specific NRAS55-64 neoepitopes within the HLA-A*01:01 groove.
a Fluorescence anisotropy (r) of 25 nM TAMRA-NRASQ61K in the presence of 4 μM unlabeled NRASQ61K/HLA-A*01:01/hβ2m and varying concentrations of the specific unlabeled competitor NRAS Q61 peptide. [NRAS] shown in μM units are 0.0 (red), 0.25 (black), 4.0 (purple), 25 (yellow). The data were analyzed by global fitting using Dynafit 4 (http://www.biokin.com/dynafit). Estimated IC50 value for NRAS Q61 binding to HLA-A*01:01/hβ2m is noted. Data are mean ± SD for n = 3 independent experiments. b Comparison of anisotropy change (Δr) for different NRAS55-64 Q61 mutants as a function of competitor concentration extracted from competition fluorescence anisotropy experiments. Data are mean ± SD for n = 3 independent experiments. c Summary of fluorescence anisotropy measured IC50 values for different NRAS55-64 Q61 mutants competing for binding to NRASQ61K/HLA-A*01:01/hβ2m. Data are mean ± SD for n = 3 independent experiments. d Summary of DSF measured thermal stability values (Tm, °C) for different NRAS55-64 Q61 mutants in complex with HLA-A*01:01/hβ2m. Data are mean ± SD for n = 3 technical replicates. e Kinetic graphs of % deuterium uptake (back-exchange corrected) for different peptide fragments as a function of HDX time (0, 20, 60, 180, or 600 s) shown for emptied (blue) versus HLA-A*01:01/hβ2m bound to different NRAS Q61 mutant peptides. Data are mean % deuterium uptake ± SD from biological triplicates. f Structure view of average % deuterium uptakes for peptide fragments of HLA-A*01:01/hβ2m bound to different NRAS Q61 mutant peptides at 600 s (back-exchange corrected) plotted onto PDB IDB 6MPP. Color ranges from deep blue (no deuterium uptake) to red (100% deuterium uptake). Mean % deuterium uptakes at 600 s (back-exchange corrected) were resolved to individual peptide fragments and obtained from biological triplicates. g Average water occupancy maps across 3 × 1 μs MD simulations for NRASQ61K/HLA-A*01:01 and NRASQ61L/HLA-A*01:01 complexes generated using VolMap tool in VMD and visualized in PyMOL v2.5.2 with isosurface contour level 0.2.

