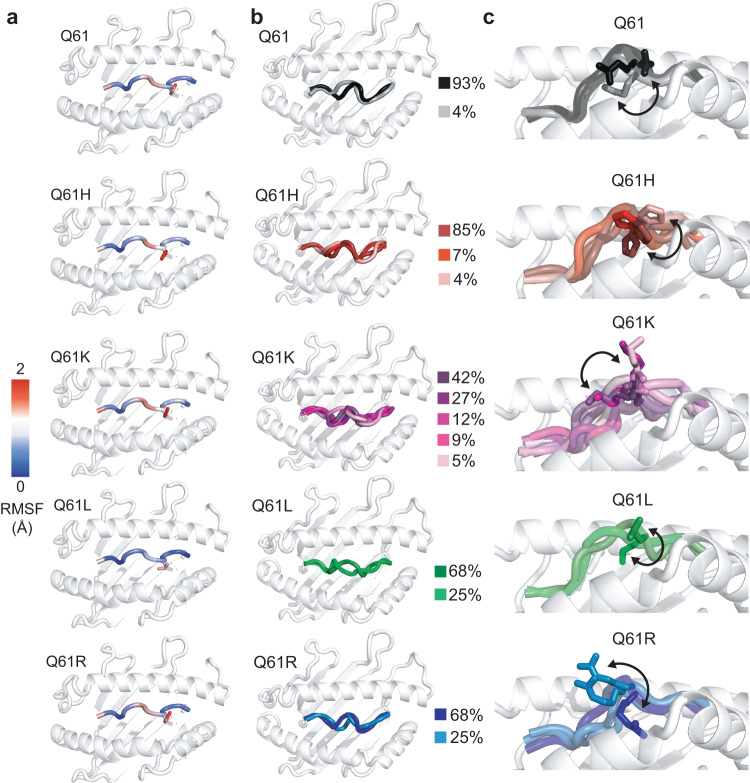
Fig. 6. MD simulations of NRAS55-64 neoepitope/HLA-A*01:01 complexes highlight differences in peptide backbone and side chain conformational landscapes.
a Root mean square fluctuation (RMSF, Å) of Cα atoms (for the peptide backbone, shown as colored cartoon) and heavy atoms (for residue 61, shown as sticks) averaged across 3 × 1 μs MD simulations. b Peptide backbone clusters generated using a backbone root mean squared deviation (RMSD, Å) cut-off of 0.5 Å. The percentage of frames corresponding to each cluster relative to the total number of frames across the three replicate trajectories (3000) is noted. c Peptide side chain clusters generated from the backbone clusters in (b) using a heavy atom RMSD cut-off of 1 Å. Arrows denote movement of the side chain for residue 61. In a–c the HLA-A*01:01 groove is shown in light gray cartoon for reference.

