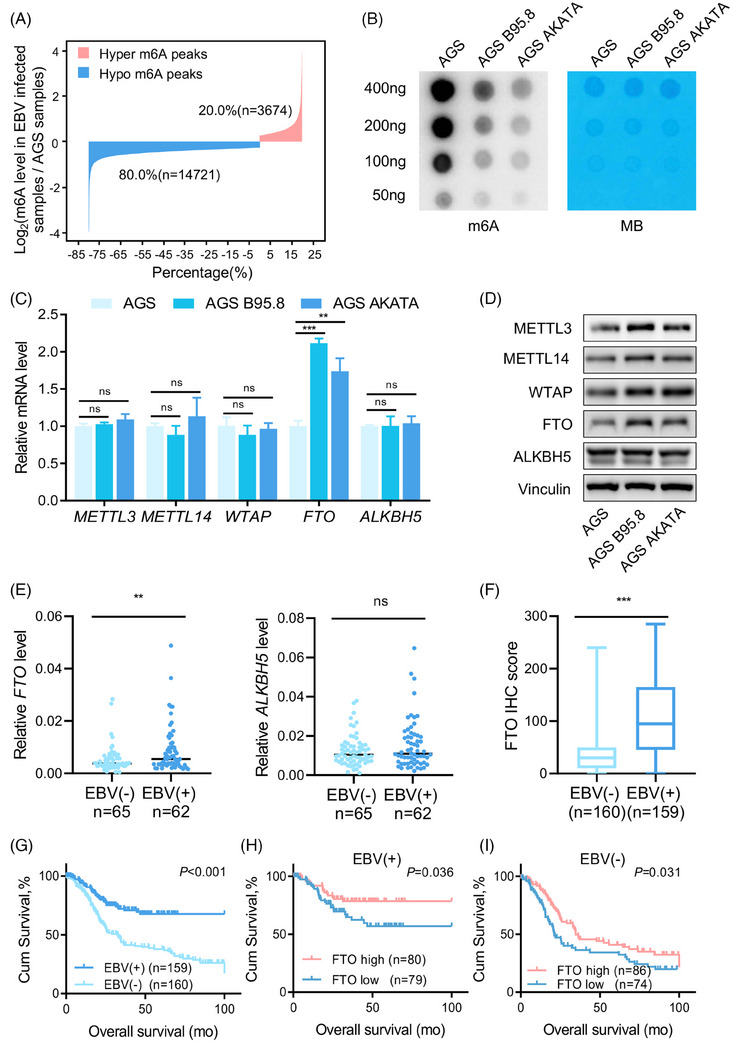
FIGURE 1.

FTO is up‐regulated in EBVaGC and associated with good prognosis. (A) Bar plot showing the distribution of methylation levels of dysregulated m6A peaks in EBVaGC cells (AGS B95.8 and AGS AKATA) compared with EBVnGC cells (AGS) with a fold‐change ≥1.2. (B) RNA m6A dot blot assays using total RNA of EBVaGC and EBVnGC cells. Methylene blue (MB) staining served as a loading control. (C and D) Real‐time PCR analysis (C) and immunoblotting assay (D) of m6A methyltransferase (METTL3, METTL14 and WTAP) and demethylase (FTO and ALKBH5) expressions in EBVaGC cells and EBVnGC cells. (E) Real‐time quantitative PCR (RT‐qPCR) analysis of mRNA expression of FTO and ALKBH5 in EBVaGC (n = 62) and EBVnGC tumour samples (n = 65) from the Sun Yat‐sen University Cancer Center (SYSUCC) cohort. (F) Immunohistochemistry (IHC) staining scores of FTO expression in EBVaGC (n = 159) and EBVnGC tumour tissues (n = 160) from the SYSUCC cohort. (G) Kaplan–Meier analysis of overall survival (OS) in GC patients from SYSUCC according to EBV status. (H and I) Kaplan–Meier analysis of OS in EBVaGC patients (H) and EBVnGC patients (I) with different FTO expression levels from the SYSUCC cohort. The FTO level was categorized as ‘high’ and ‘low’ based on the median score (median score = 95) in EBVaGC tumour tissues and the median score (median score = 30) in EBVnGC tumour tissues. The data in (C, E and F) are presented as the means ± SDs. p‐Values were determined by Student's t test (C, E and F) and calculated by Kaplan–Meier analysis with the log‐rank test (G–I). *p < 0.05; **p < 0.01; ***p < 0.001. Vinculin was used as a loading control.
