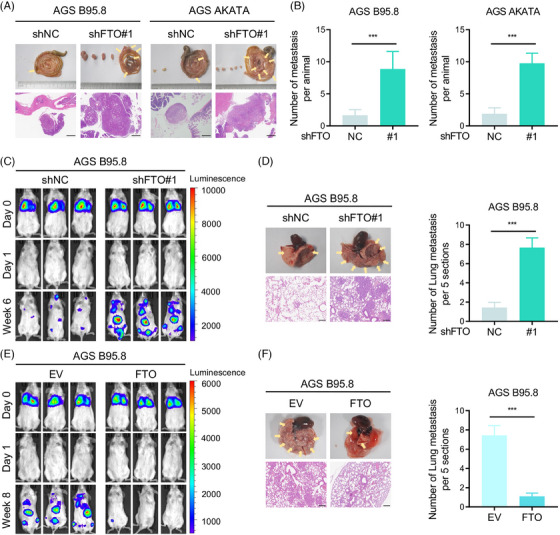
FIGURE 3.

FTO suppressed EBVaGC cell metastasis in vivo. (A) Abdominal and intestinal metastatic nodules of the FTO knockdown and control groups (n = 9 per group) were photographed (top), and haematoxylin and eosin (H&E) staining was performed (bottom). Scale bar: 500 µm. (B) Metastatic numbers of AGS B95.8 (left) and AGS AKATA (right) cells were recorded. (C) Bioluminescence imaging of the B‐NDG mouse lung metastasis model with shFTO#1 and shNC luciferase‐labelled AGS B95.8 cells at day 0, day 1 and week 6 (n = 9 per group). (D) Representative specimen and H&E staining photographs (left) of lung metastatic nodules from B‐NDG mice injected with FTO‐knockdown and control AGS B95.8 cells via the tail vein, and lung metastatic nodules under a microscope were recorded (right). Scale bar: 200 µm. (E) Representative luciferase imaging of the B‐NDG mouse lung metastatic model in the FTO‐overexpressing (FTO) and empty vector (EV) groups at day 0, day 1 and week 8 (n = 9 per group). (F) Representative specimen and H&E staining photographs (left) of the metastatic nodules in the lung, and lung metastatic nodules were recorded (right). Scale bar: 200 µm. The data in (B, D and F) are presented as the means ± SDs. p‐Values were determined by Student's t test. *p < 0.05; **p < 0.01; ***p < 0.001.
